Himaja’s birthday is December 12. She’ll be 25 (Gen Z).
Jerry’s birthday is 1/1; he’ll be 40 (Millenial).
I have fond memories of being 25.
Given the restriction on reproductive justice, I am relieved to have those years behind me and would not want to repeat them, even with what I know now.
Would you?
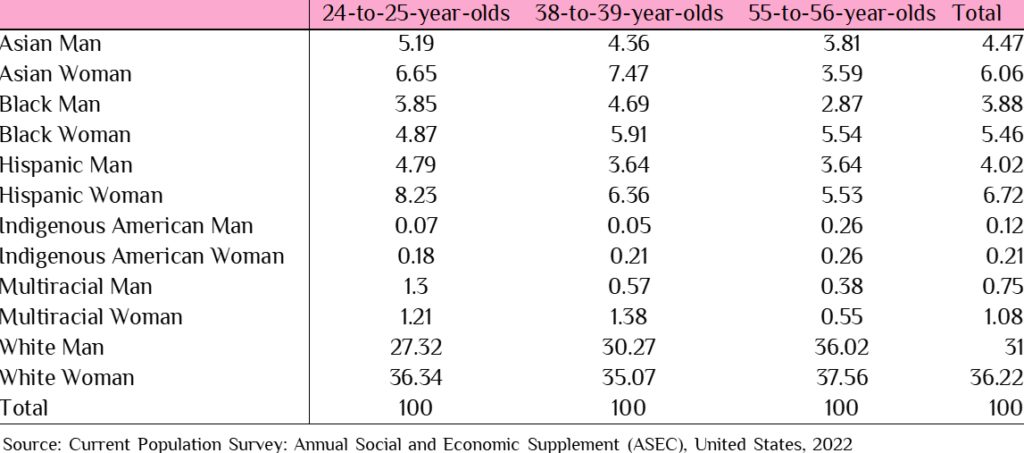
Today, in honor of Himaja’s and Jerry’s upcoming birthdays, I provide a portrait of the men and women in our age categories with at least a bachelor’s degree.
Table 1 reflects what the U.S. Census Bureau has been telling us for decades. The U.S. is more diverse, with a larger share of the population identifying as Asian or Hispanic.
Table 1. Distribution by Ethnicity, Race, and Gender
1965 Immigration Act
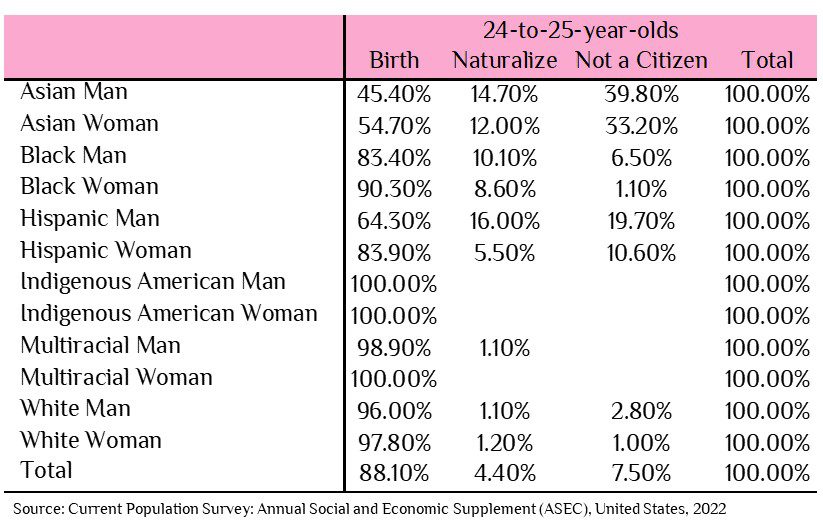
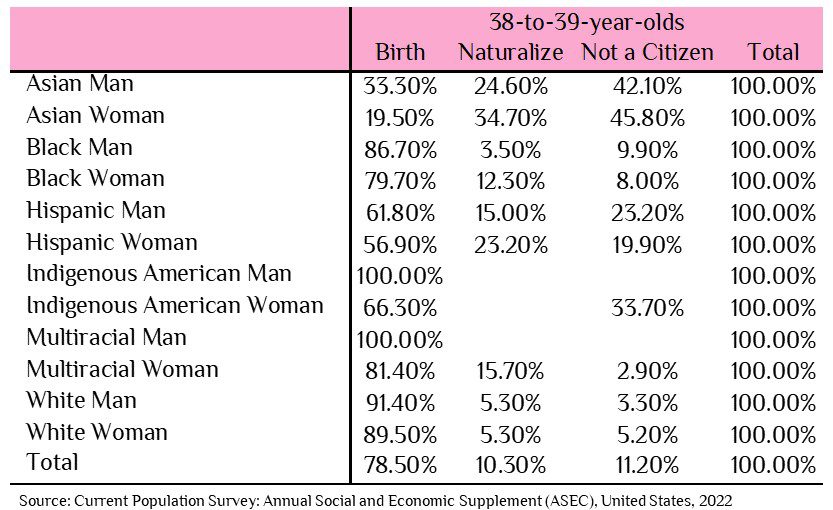
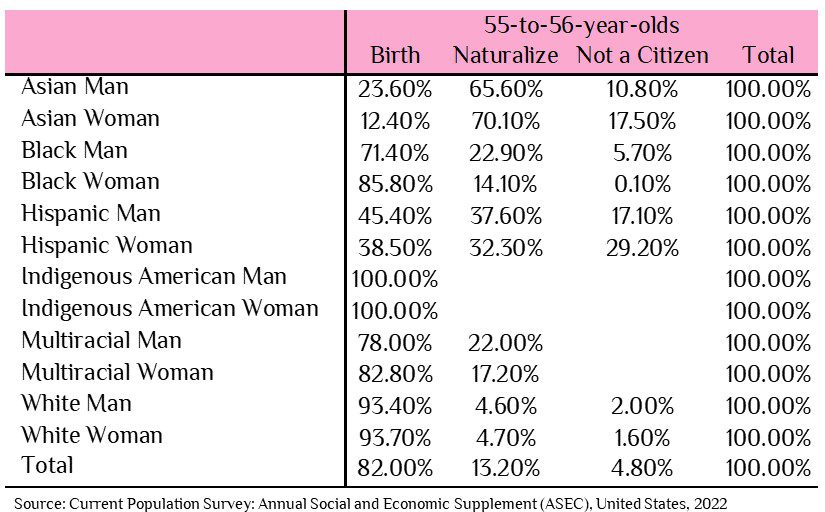
Women in the 24-to25-year-old group were more likely to be citizens by birth than men. A smaller share of the 54-to-55-year-old group were not citizens compared to the 24-to-25-year-old and 38-to-39-year-old groups.
The increase in the 24-to-25-year-olds and 38-to-39-year-olds who are citizens by birth or naturalization is likely the result of the 1965 Immigration Act, which eliminated quotas based on national origin and implemented immigration policy based on reuniting immigrant families and attracting skilled labor.
Table 2. Citizenship by Ethnicity, Race, and Gender
In my next WISER Wednesday, I’ll provide data on occupations and earnings.
If you have enjoyed Himaja’s or Jerry’s WISER Wednesdays, please consider donating $25 or $40 as your end-year donation.
Be well,
Rhonda
