Introduction
Criminal sentencing is complex. For example, an officer has discretion about who gets a speeding ticket; prosecutors have discretion about what charges are brought, and judges often have latitude on sentencing outcomes. How bias operates at each stage is an artifact of sentencing data.
This study extends our analysis of the experiences of females with the federal criminal system by focusing on trends in prison sentencing. This study will juxtapose the findings below with what we observe from our analysis of the sentencing data.
In addition to providing a descriptive analysis of the data, we examine how ethnicity affects the rates of who gets sentenced to (probation vs. prison) for White females specifically. This shows if there is a difference in sentencing outcomes for Hispanic versus Non-Hispanic White females.
The data for this study comes from the US Sentencing Commission’s monitoring database. Race is defined as the race of the sentenced offender (Asian/Pacific Islander, Black, Native American, and White), and ethnicity is defined as Hispanic/Non-Hispanic. A citizen is defined as a US citizen or non-US citizen. We examine the following questions:
- Has sentencing experienced similar inclines and declines as arrests and bookings?
- Are there disparities in the racial representation of females sentenced compared to those arrested?
- Are there disparities in the racial and ethnic representation of the different types of sentences received (probation only, prison only)?
Female Sentencing Trends
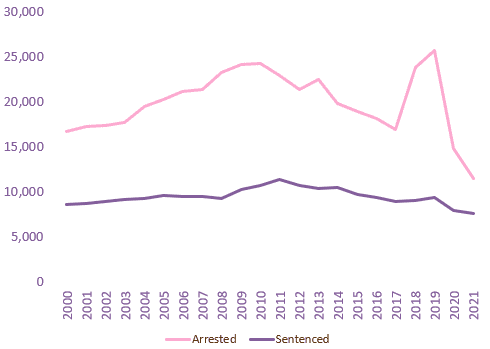
Graph 1 shows the total number of women arrested and sentenced from 2000 to 2021. Since everyone arrested is not always found guilty or charged with a crime, fewer females were sentenced than arrested for each year over this period. Additionally, the trend for females sentenced was much flatter and less volatile than the trend for females arrested.
Several factors may explain these findings. First, the difference in arrests and sentencing could be a function of court capacity constraints, i.e., only a set number of cases can be heard each year. Second, charges could have been dropped, or the defendant could have been found not guilty. (Unfortunately, the data collected on defendants charged in criminal cases does not allow us to analyze ‘charges dropped’ or ‘not guilty verdicts’ by gender or race.) Finally, the flatter line could be the function of both of these reasons and the fact that 97% of federal cases are closed by a plea deal.
Graph 1: Females Arrested vs. Sentenced Comparison 2000 – 2021
Calculations by the Females’ Institute for Science, Equity and Race. Data Source: US Sentencing Commission Monitoring Data Base
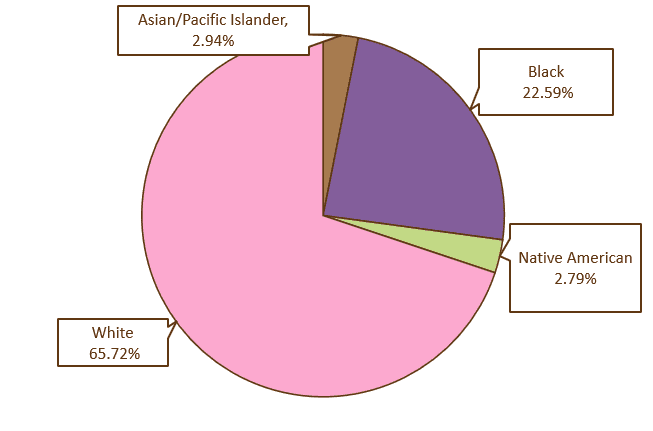
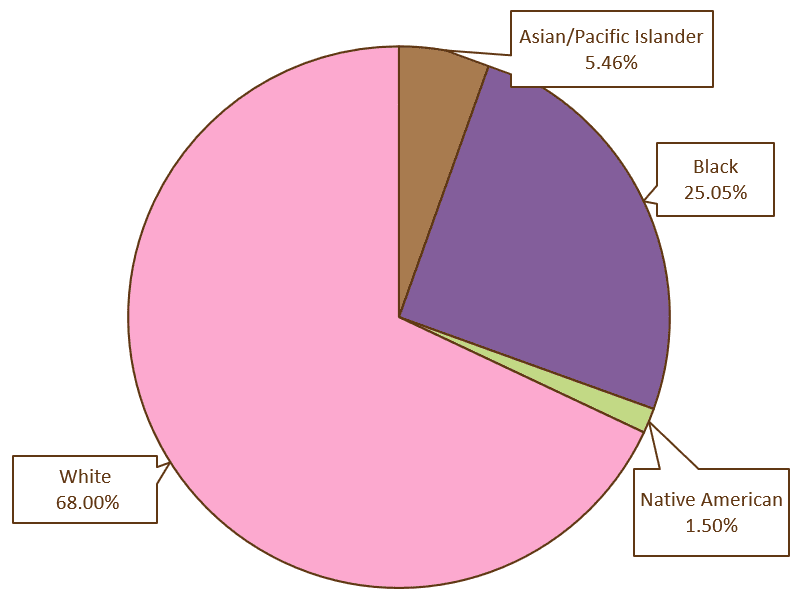
Disaggregating the female sentencing data by race, we find that White females, on average, were 70 percent of females sentenced, followed by Black females at 24 percent. Asian/Pacific Islander and Native American females each represented about 3 percent of the females sentenced(See Chart 1).
Chart 1: Average Percent of Females Sentenced by Race 2000 – 2021
Calculations by the Females’ Institute for Science, Equity and Race. Data Source: US Sentencing Commission Monitoring Data Base
Sentences: Fines, Probation, and Prison
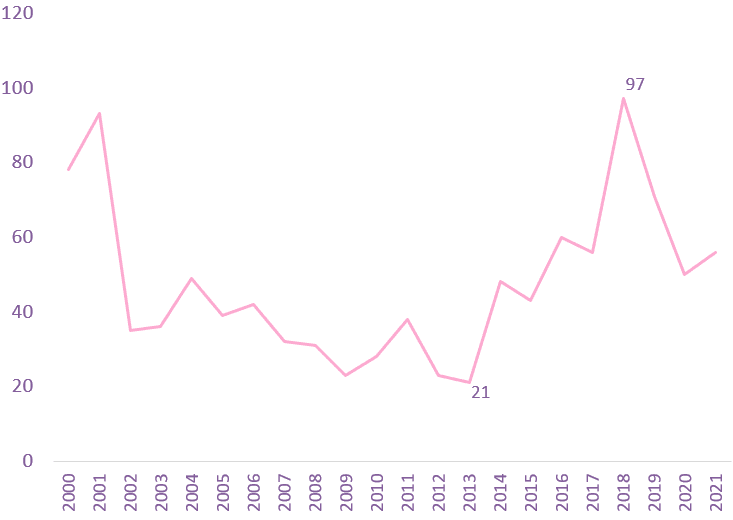
To identify how each demographic of females was sentenced, we disaggregated the data by the type of sentence imposed (fine only, probation, or prison). We isolated our discussion on the trend of women who received ‘fines only’ due to the relatively low quantities compared to probation and prison sentences. Graph 2 shows that over this period, the number of females sentenced to a fine ranging from a low of 21 to a high of 97. In addition, the trend is erratic over this period and displays no patterns.
Graph 2: Females Sentenced to a Fine Only
Calculations by the Females’ Institute for Science, Equity and Race. Data Source: US Sentencing Commission Monitoring Data Base
Chart 2: Avg Percent of Females Sentenced to a Fine Only by Race 2000 – 2021
Calculations by the Females’ Institute for Science, Equity and Race. Data Source: US Sentencing Commission Monitoring Data Base
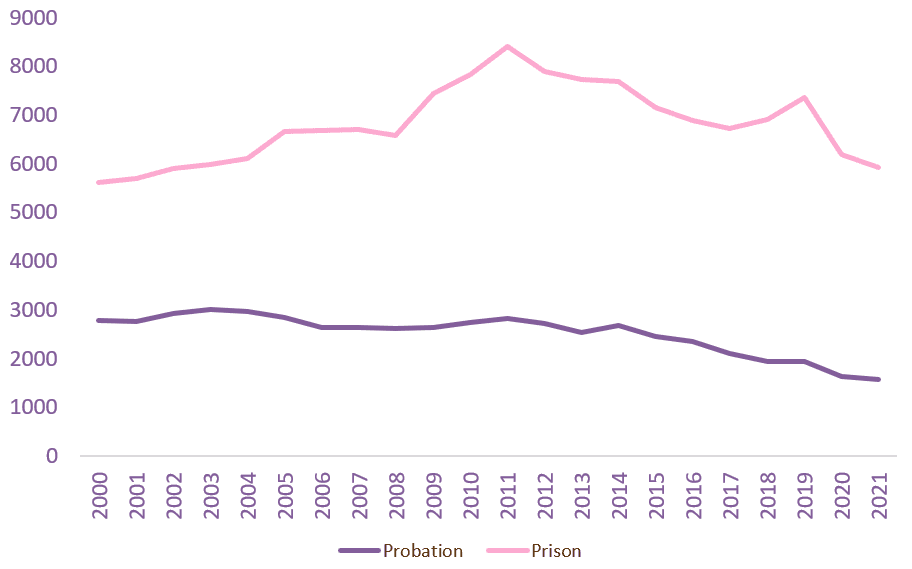
Graph 3 compares females sentenced to probation or prison and shows an uptick in the number of females sentenced to prison sentences and a slow, steady decline in the number of females sentenced to probation.
Graph 3: Females Sentenced to Probation vs. Prisons
Calculations by the Females’ Institute for Science, Equity and Race. Data Source: US Sentencing Commission Monitoring Data Base
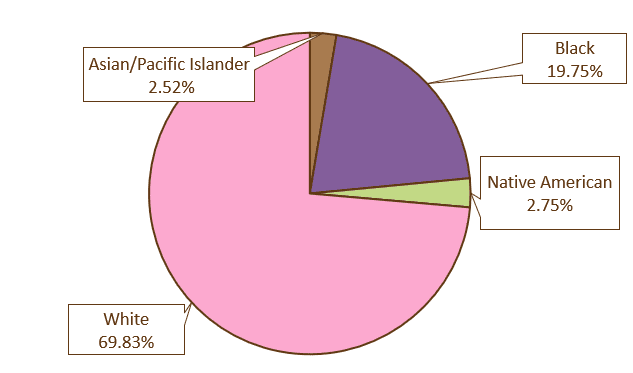
Chart 3: Avg Percentage of Females Sentenced to Probation by Race 2000 – 2021
Calculations by the Females’ Institute for Science, Equity and Race. Data Source: US Sentencing Commission Monitoring Data Base
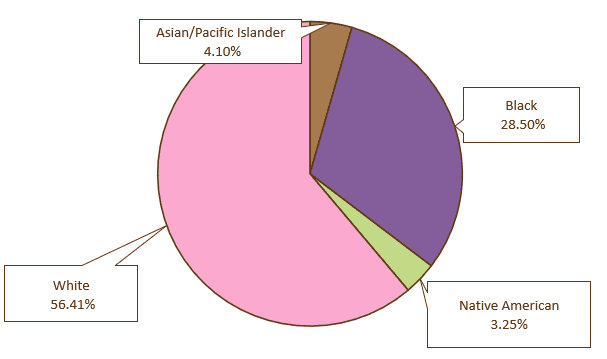
Charts 3 and 4, respectively, show the average percentage of females sentenced to probation and prison. The average percentage of Asian, Black, and Native American females sentenced to prison was less than the average sentenced to probation. However, for White females, the results are reversed. White females have represented an average of around 56% percent of females sentenced to probation and nearly 70 percent of females sentenced to prison.
Chart 4: Avg Percentage of Females Sentenced to Prison by Race 2000 – 2021
Calculations by the Females’ Institute for Science, Equity and Race. Data Source: US Sentencing Commission Monitoring Data Base
We also observe this dynamic when we compare overall sentencing trends with probation and prison sentencing trends by race. From 2000 to 2021, Asian and Black females were overrepresented in terms of parole sentencing compared to their overall sentencing trends and underrepresented in prison sentences. (See Graphs 4 – 5). Native American females are overrepresented in the category of parole sentencing compared to their overall sentencing levels. However, their prison sentencing and overall sentencing levels are nearly identical throughout the period. (See Graph 6). Finally, White females are overrepresented in prison sentencing and underrepresented in parole sentencing. This finding is the opposite of what we find for Asian, Black, and Native American females. (See Graph 7).
Graph 4: Avg Percentage of Asian Females by Sentence Type 2000 – 2021
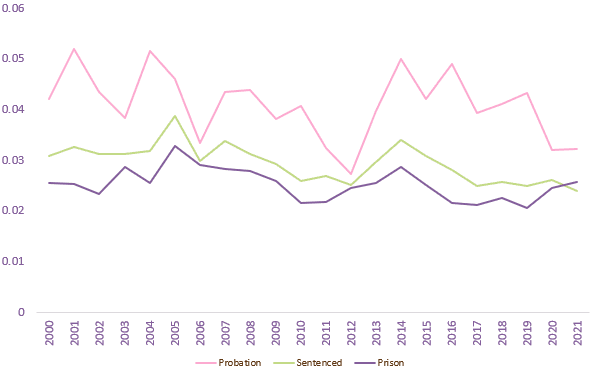
Calculations by the Females’ Institute for Science, Equity and Race. Data Source: US Sentencing Commission Monitoring Data Base
Graph 5: Avg Percentage of Black Females by Sentence Type 2000 – 2021
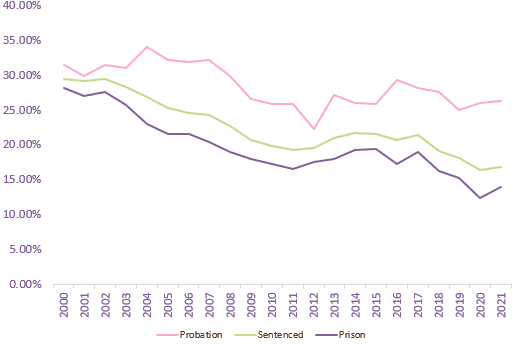
Calculations by the Females’ Institute for Science, Equity and Race. Data Source: US Sentencing Commission Monitoring Data Base
Graph 6: Avg Percentage of Native American Females by Sentence Type 2000 – 2021
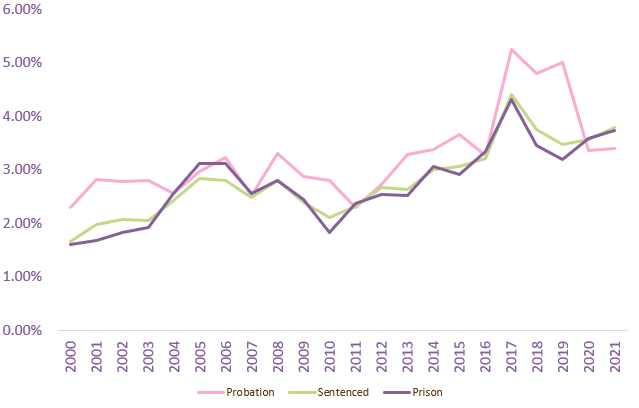
Calculations by the Females’ Institute for Science, Equity and Race. Data Source: US Sentencing Commission Monitoring Data Base
Graph 7: Avg Percentage of White Females by Sentence Type 2000 – 2021
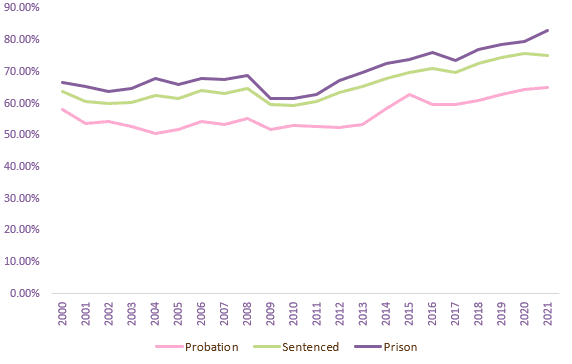
Calculations by the Females’ Institute for Science, Equity and Race. Data Source: US Sentencing Commission Monitoring Data Base

Ethnicity’s Role in Sentencing Trends
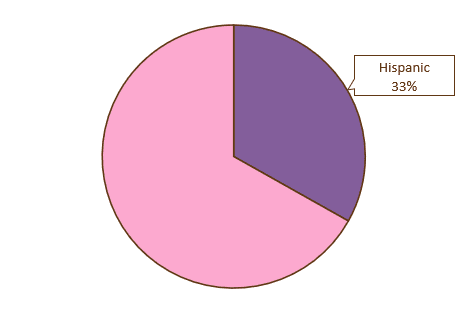
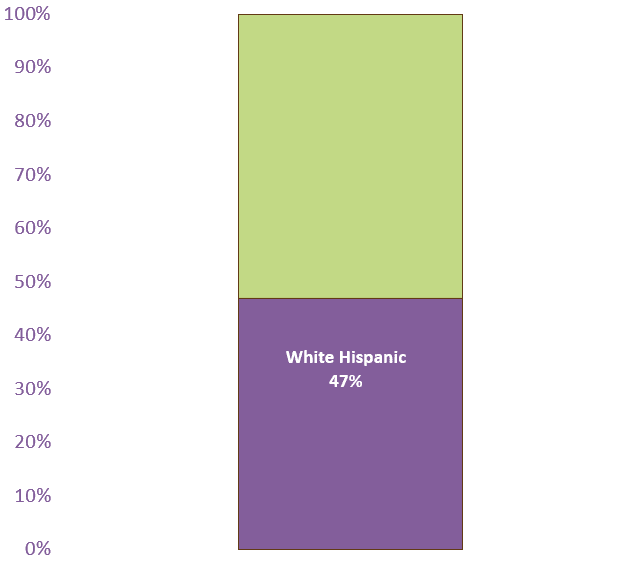
Incorporating the experiences of Hispanic females helps explain the somewhat irregular trends we find when analyzing the sentencing trends of white females. Hispanic women represented an average of 33 percent of all females sentenced over this period (see Chart 5), while 47 percent of White females were identified as Hispanic. (See Chart 6.)
Chart 5: Avg Percentage of Females Sentenced 2000 – 2021 by Ethnicity
Calculations by the Females’ Institute for Science, Equity and Race. Data Source: US Sentencing Commission Monitoring Data Base
Chart 6: Avg Percentage of White Females Sentenced 2000 – 2021 by Ethnicity
Calculations by the Females’ Institute for Science, Equity and Race. Data Source: US Sentencing Commission Monitoring Data Base
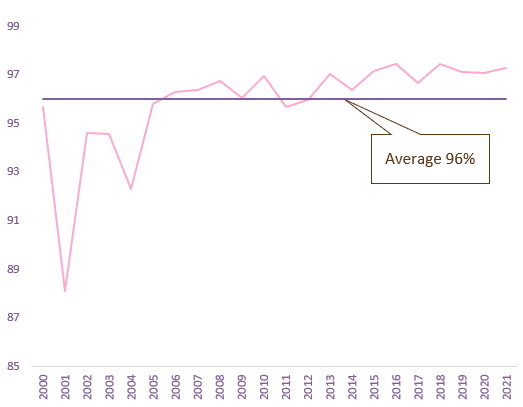
Graph 8: Percentage of Hispanic Females Sentenced Identified as White 2000 – 2021
Calculations by the Females’ Institute for Science, Equity and Race. Data Source: US Sentencing Commission Monitoring Data Base
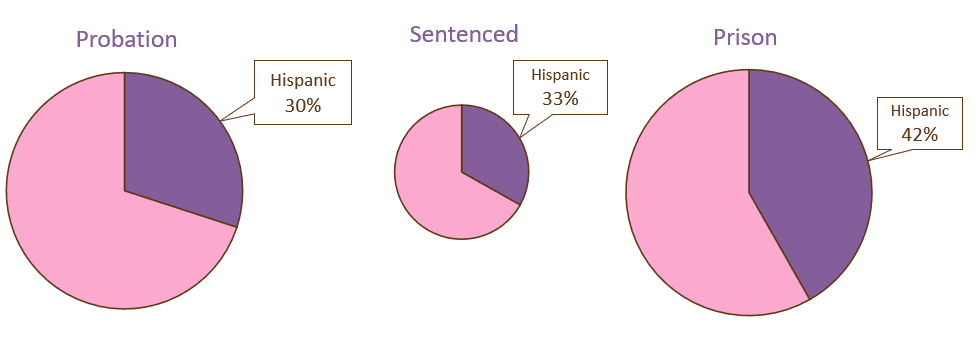
Chart 7: Avg Percentage of Hispanic Females Sentenced 2000 – 2021 by Sentence Type
Calculations by the Females’ Institute for Science, Equity and Race. Data Source: US Sentencing Commission Monitoring Data Base

Chart 8: Avg Percentage of Non-Hispanic White Females Sentenced 2000 – 2021 by Sentence Type
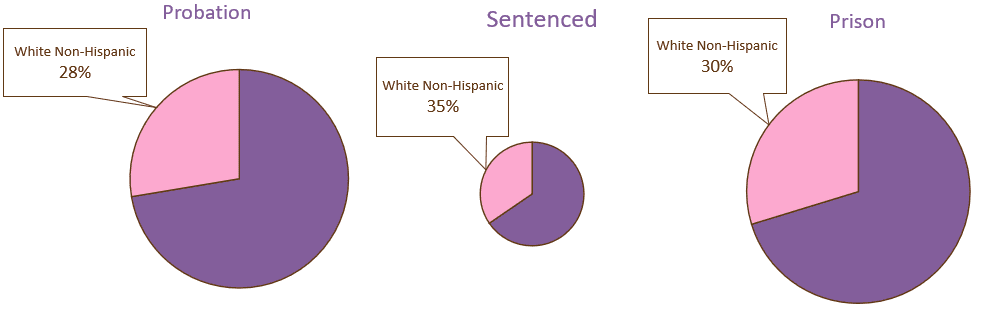
Calculations by the Females’ Institute for Science, Equity and Race. Data Source: US Sentencing Commission Monitoring Data Base
Chart 8 illustrates the average representation of Non-Hispanic White females sentenced overall compared to those who received probation or prison sentences. For both probation and prison sentencing, Non-Hispanic White females were underrepresented compared to the percentage of Non-Hispanic females who were sentenced overall. This suggests that White Non-Hispanic women are less likely to be sentenced to harsher penalties, allowing them to maintain work and family relationships.
Policy Recommendations
- Establish independent review boards to analyze federal judges’ sentencing patterns for racial and ethnic inconsistencies.
- Simplify penal sentencing codes to remove unnecessary discretion by judges in the type of sentences issued.
- Establish an annual review process to identify inequalities in charges filed by federal prosecutors.
Conclusion
In part one of this study, we found that arrest and booking trends from 2000 to 2021 were driven by immigration offenses at the federal level and not necessarily drug offenses. We also found that disaggregating the data by citizenship revealed higher arrest patterns for White females. Correcting for this issue, we found much lower rates of arrests for White women. In part two, we find similar patterns of inequality hidden in the aggregated data. At first glance, White females appear to be overrepresented in prison sentencing compared to their general sentencing rates for women. However, once we separate Hispanic from Non-Hispanic White females, we find that Non-Hispanic White females are underrepresented in probation and prison sentencing. To conclude this three-part study, we will investigate the federal prison population for women by race and ethnicity.