Introduction
This study examines changes in arrest rates for women from 2000 to 2021, thereby capturing changes during the Great Recession, recovery, and the start of the COVID-19 pandemic. We sought to identify changes in arrest rates for women that may reveal racial disparities, thereby providing support for criminal justice reform that leads to more equitable outcomes.
We utilized data from the U.S. Marshals Service Prisoner Tracking System. Race is defined as the race of the arrestee (Asian/Pacific Islander, Black/Black Hispanic, Native American/Alaskan, White/White Hispanic, Unknown); therefore, Hispanics are not isolated as they are not a racial group. Citizen is defined as U.S. citizen or non-U.S. citizen. The analysis is descriptive and seeks to answer the following questions:
1. What are the arrest trends for females for 2000–2021?
2. How do arrest trends change when the data are disaggregated by race and sex?
3. Do arrest trends vary by citizenship?
Female Arrest Trends
Graph 1 shows the trend in total female arrests from 2000 to 2021. Significant increases occurred in 2004 and 2008, which could be explained by high unemployment rates extended from recessions in 2001 and 2007. Following a peak in arrests in 2010, arrests decreased steadily until 2018 with the exception of 2013 when there was a 4.89 percent increase. In addition, arrests decreased by 42 percent during the COVID-19 pandemic. Graph 2 shows the top four offense types for female arrest. While property offenses, drug offenses, and supervision violations either decreased or remained flat over the period, immigration offenses increased significantly before the pandemic.
Graph 1: Total Female Arrests 2000 – 2021
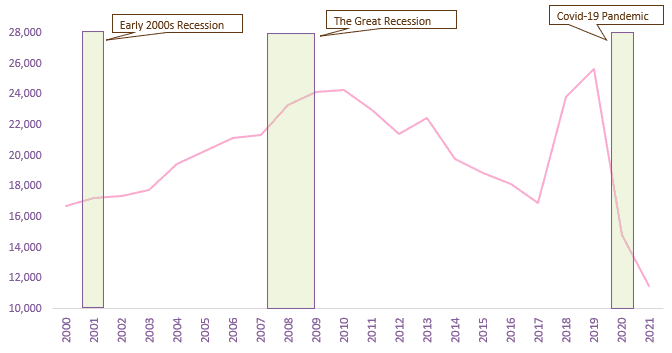
Source: Calculations by the Women’s Institute for Science, Equity and Race. Data Source: U.S. Marshals Service Prisoner Tracking System
Graph 2: Leading Offense Types for Female Arrests 2000 – 2021
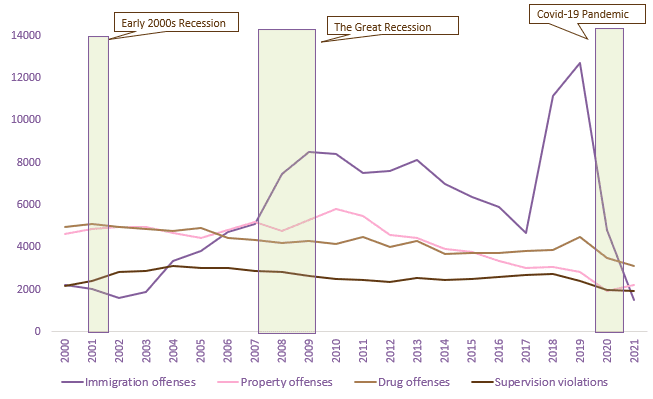
Source: Calculations by the Women’s Institute for Science, Equity and Race. Data Source: U.S. Marshals Service Prisoner Tracking System
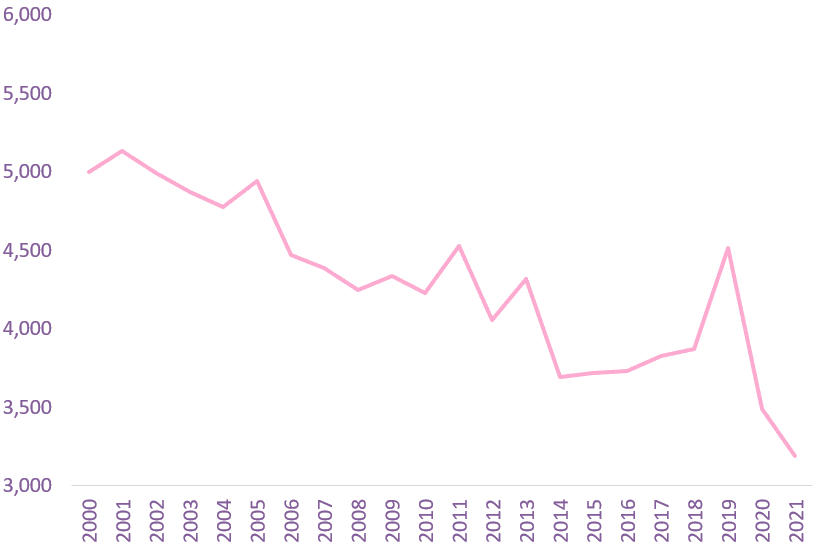
Disaggregating the data by race (Graphs 3–6) shows that even if total female arrests trended upward through 2019 at the federal level, each demographic of women didn’t necessarily experience the same shifts. Asian and Black women had a decrease in total arrests over that period, while Native American and White women had an increase.
Graph 3: Total Asian Female Arrests Graph 4: Total Black Female Arrests
Source: Calculations by the Women’s Institute for Science, Equity and Race. Data Source: U.S. Marshals Service Prisoner Tracking System
Graph 5: Total Native American Female Arrests Graph 6: Total White Female Arrests
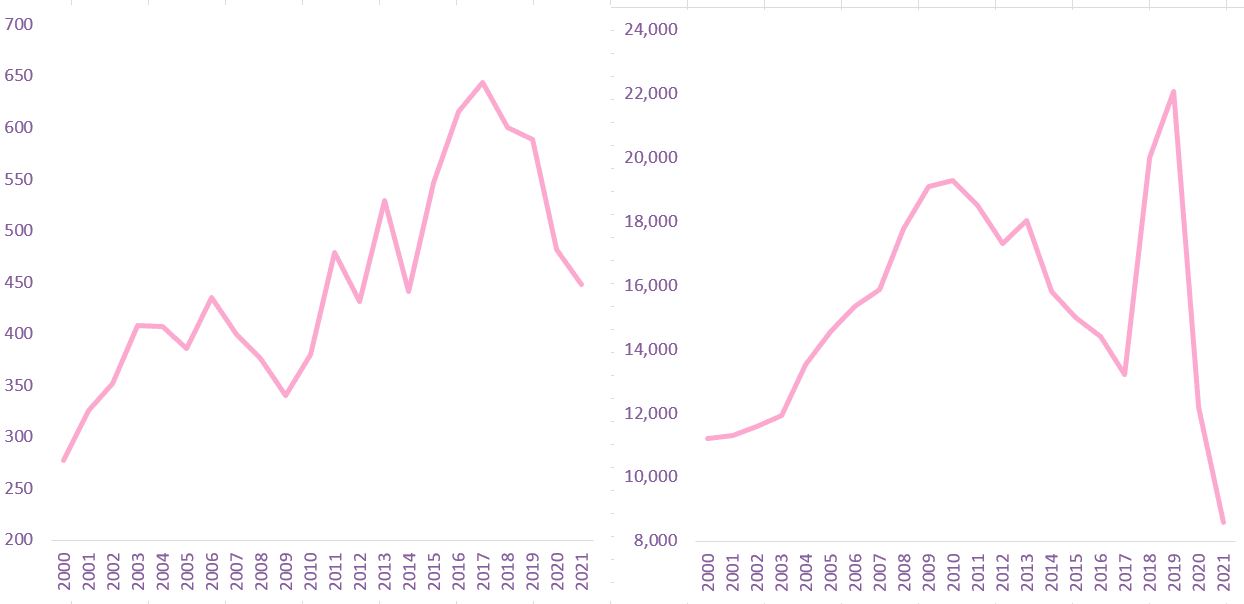
Source: Calculations by the Women’s Institute for Science, Equity and Race. Data Source: U.S. Marshals Service Prisoner Tracking System
How are Drug Offenses Impacting Trends
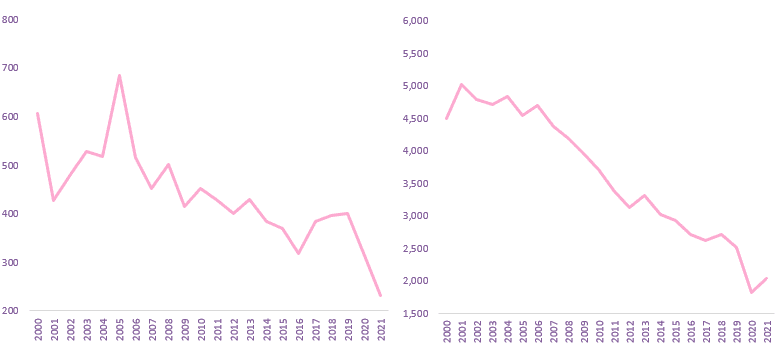
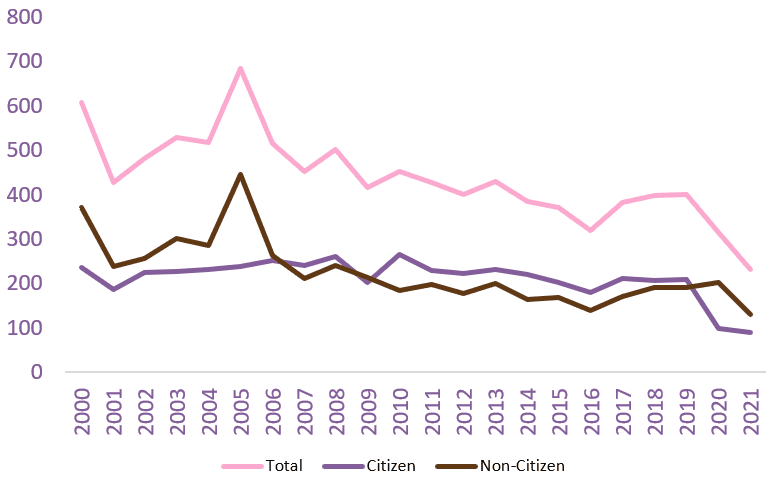
It is helpful to see how these trends differ, but it is also important to investigate why these differences might be occurring. According to Prison Policy Initiative’s 2020 report, drug-related arrests increased nearly 216 percent from 1985 to 2019. However, our analysis shows an overall decrease in total drug related arrests after 2000(See Graph 7).
Next, we isolated the total arrests of Native American and White females to see if the increases in total arrests could be attributed to a rise in drug offenses. In 2000, Native American females were arrested 37 times for drug offenses but experienced an increase to 80 arrests in 2021. This increase in drug offenses of 116 percent for Native American females was smaller than the increase in arrests caused by supervision offenses, a 146 percent increase. Supervision arrests increased from 71 arrests in 2000 to 175 arrests in 2021.
White females were arrested 3,566 times for drug offenses in 2000 but had fewer drug arrests in 2021, 2,484, a 30 percent decrease. Therefore, isolating the causes of arrests indicates that the increase in arrests for White women through 2019 was due to immigration offenses, not drug offenses.
Graph 7: Female Arrests for Drug Offenses: 2000 – 2021
Source: Calculations by the Women’s Institute for Science, Equity and Race. Data Source: U.S. Marshals Service Prisoner Tracking System
Does Citizenship Status Play a Role
We further disaggregated arrest data by citizenship to identify differences, if any, in arrest trends by citizenship status. For Asian female citizens, total arrests remained relatively flat, but non-citizen Asian females experienced a decrease in total arrests (See Graph 8).

Graph 8: Arrest Trends for Asian Females by Citizenship Status: 2000 – 2021
Source: Calculations by the Women’s Institute for Science, Equity and Race. Data Source: U.S. Marshals Service Prisoner Tracking System
While the statistics for both groups of Black females (Graph 9) trend downward, one notable difference are the relatively low arrest totals for non-citizen Black females compared to Black female citizens. In 2000, non-citizens represented 15 percent of all Black female arrests at the federal level; in 2019 that number was even lower, around 6 percent. Only Native American females had a lower percentage of non-citizens arrested at the federal level (8 percent in 2000, 1 percent in 2019).
Graph 9: Arrest Trends for Black Females by Citizenship Status: 2000 – 2021
Source: Calculations by the Women’s Institute for Science, Equity and Race. Data Source: U.S. Marshals Service Prisoner Tracking System
Native American females have experienced the most troubling trend, particularly in the arrests of Native American female citizens (See Graph 10). Although the arrest totals are low, they have experienced nearly a 130 percent increase from 2000 to 2018, the largest increase in total arrests except for White non-citizen females. Similar results were found in a study conducted by Native News Online. This increase is more difficult to explain than the increase for White non-citizen females, which seem to be due to the increasing arrests of illegal immigrants. One explanation for the increase in Native American arrests, stated by Dr. Ciara Hansen, a clinical psychologist in the lina’ Counseling services department at the Northern Navajo Medical Center, is that “Like many modern challenges in Indian Country, over-incarceration of Indigenous people is intimately tied to colonial violence and upheld by policies throughout the years.”
This rationale is not new nor unique to Dr. Hansen’s point of view. In their report on colonialism and criminal justice for indigenous peoples, Nielsen and Robyn highlight that American scholars recognize that marginalization is related to criminal issues and that the marginalization of indigenous peoples is a direct result of colonialism. In addition, they highlight similar patterns found in Australia, Canada, and New Zealand to buffer the argument.
Graph 10: Arrest Trends for Native American Females by Citizenship Status: 2000 – 2021
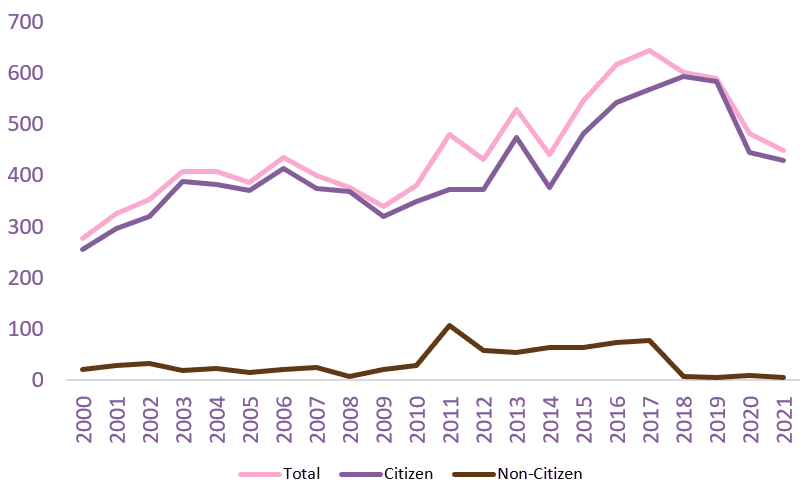
Source: Calculations by the Women’s Institute for Science, Equity and Race. Data Source: U.S. Marshals Service Prisoner Tracking System
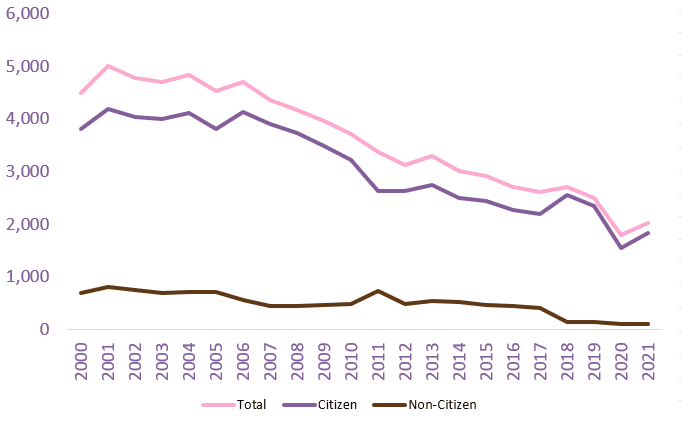
Finally, looking at the total arrest trend for White females, we find an initially somewhat deceptive result. Without disaggregating the data by citizenship, there appears to be an enormous increase in the arrest of White females over this period. That has not exactly been the case. While there was a 96 percent increase in the number of total arrests for White females from 2000 to 2019, this was primarily driven by the increase in the arrest of White non-citizen females, who experienced a 227 percent increase in total arrests during those years (See Graph 11).
Graph 11: Arrest Trends for White Females by Citizenship Status: 2000 – 2021
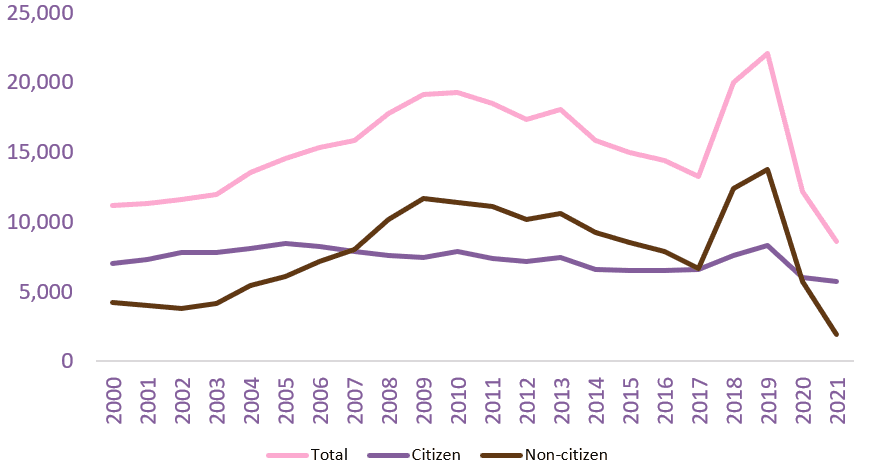
Source: Calculations by the Women’s Institute for Science, Equity and Race. Data Source: U.S. Marshals Service Prisoner Tracking System
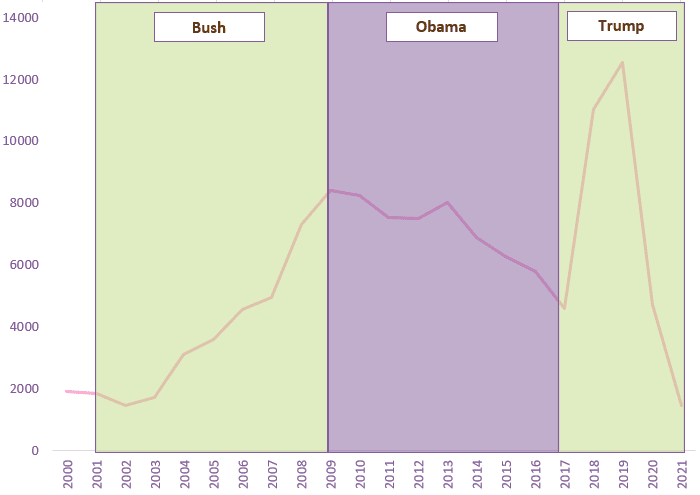
Graph 12: Arrests of White Females for Immigration Offenses 2000-2021
Source: Calculations by the Women’s Institute for Science, Equity and Race. Data Source: U.S. Marshals Service Prisoner Tracking System
Furthermore, arrest of White females for immigration offenses increased during the Republican presidency years and decreased during the Democratic presidency years (See Graph 12). The largest increase occurred between the start of the Trump administration and the beginning of the Covid-19 pandemic. Such arrests soared from 4,582 in 2017 to 12,537 by the end of 2019, a 174 percent increase.
One primary culprit for this increase in arrests has been the initiation of 287(g) agreements between the U.S. Immigration and Customs Enforcement (ICE) department and local sheriff’s offices. This program effectively turns local sheriffs and their deputies into ICE agents. A similar increase in overall arrests for White non-citizen females in 2000 versus 2021 (See Graph 13). These growing arrests have increased the volume of an already strained immigration justice system.
Graph 13: Arrests of White Non-Citizen Females: 2000 vs. 2021
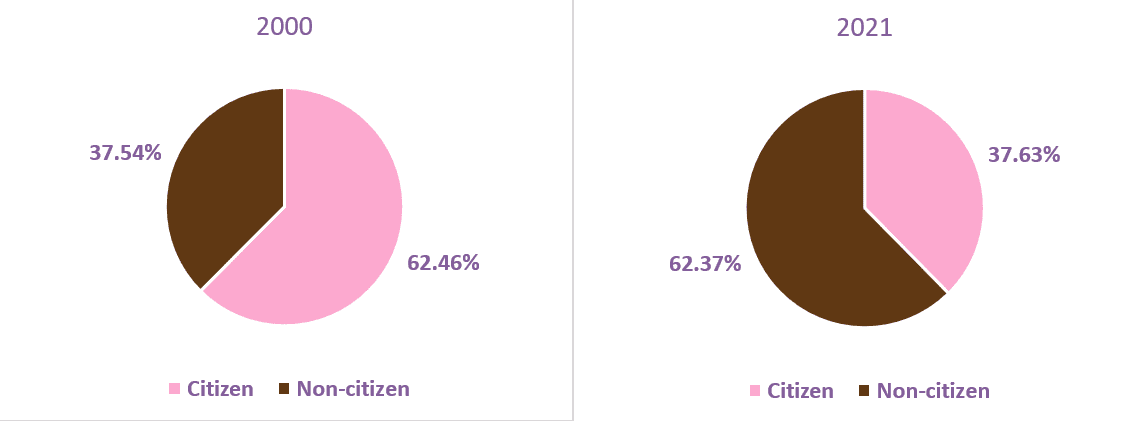
Source: Calculations by the Women’s Institute for Science, Equity and Race. Data Source: U.S. Marshals Service Prisoner Tracking System
Policy Recommendations
- Redirect federal taxpayer dollars from drug enforcement services to treatment and community reentry programs that can help prevent substance abuse and help women access needed resources.
- Limit the number of arrests and jailable offenses by reclassifying non-public safety threatening offenses as ones punishable by fines.
- Invest in low-income housing that can help reduce homelessness, which has historically been a major factor related to criminal activity.
Conclusion
This study shows that, on the federal level at least, the increases in total arrests for women may be less related to drug offenses and more related to an increase in supervision and immigration offenses. While solutions in each area are needed, it is important to devote the proper resources to appropriate areas of need. This report may also provide evidence that federal arrests are more directly influenced by policies of the current presidential administration than by state and local levels, as indicated by the dramatic increase in arrests for immigration offenses that occurred at the beginning of the Trump administration. In addition, while this study sheds some light on the issue of arrests and bookings, this is just one aspect of the criminal justice system. A comprehensive look at the criminal justice landscape—the court system and institutional facilities–is needed to understand how it affects each group of women.