Introduction
In part one and two of this series we examined the federal arrest and sentencing trends from 2000 to 2021. We found that arrest trends were more volatile during the period than sentencing trends. In addition, the federal arrest and sentencing data showed that not only did race and ethnicity play a role in some of the nuances we discovered, but also citizenship status. Here in part three, we examine the female federal prison population statistics from 2000 to 2021.
Some people may incorrectly assume that once a person is sentenced to prison and serves time that their involvement with the criminal justice system is done. As chart 1 displays, even though the systems of probation and parole may reduce time spent in prison, they can also lead to an extension of time in the system in cases where individuals violate their stipulations of release. Furthermore, in this simple diagram we can observe seven layers of decisions that could potentially impact the outcome of an arrested individual. From whether an individual is actually charged, to whether they are found guilty, to the type and length of sentences issued by the judge, to whether parole is granted all have the potential to lessen or worsen the punishment an individual receives for being arrested for a crime.
Chart 1: Criminal Justice System
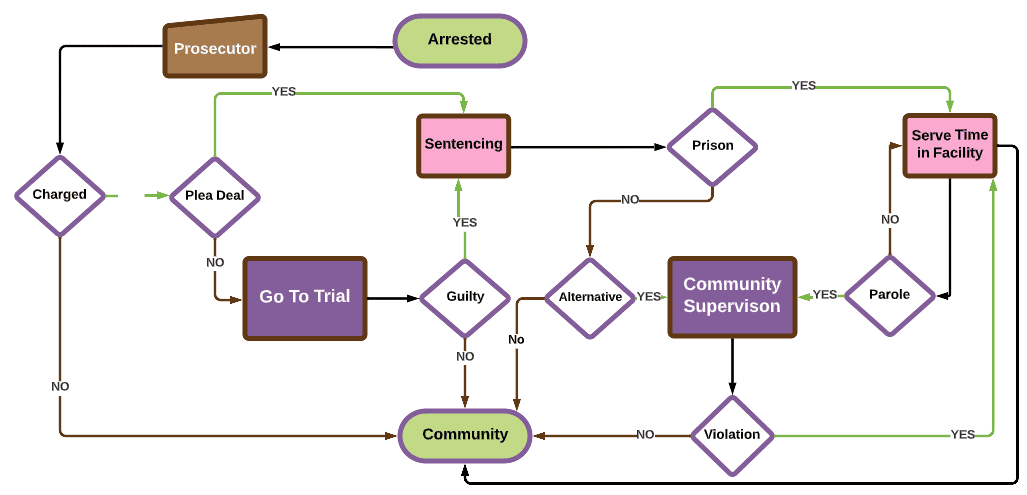
Chart produced by the Women’s’ Institute for Science, Equity and Race.
Adding to our descriptive analysis of the data, we examine how race and ethnicity affects the prison population rates and types of crimes committed.
The data for this study comes from the Bureau of Prisons’ online Sentry System. Race is defined as the race of the imprisoned individual (Asian/Pacific Island, Black, Native American, and White), and ethnicity is defined as Hispanic/Non-Hispanic. A citizen is defined as a US citizen or non-US citizen. We seek to answer the following questions:
- Has sentencing experienced similar inclines and declines as arrests and bookings?
- Are there disparities in the racial representation of females sentenced compared to those arrested?
- Are there disparities in the racial and ethnic representation of the different types of sentences received (probation only, prison only)?
Female Incarceration Trends
Graph 1 shows the arrests, sentencing, and incarceration trends from 2000 to 2021. There are strong similarities between the federal sentencing and incarceration trends for women during the period. Each trend experienced a gradual increase followed by a period of slow decline.
Graph 1: Females Arrested, Sentenced, and Incarcerated 2000 – 2021
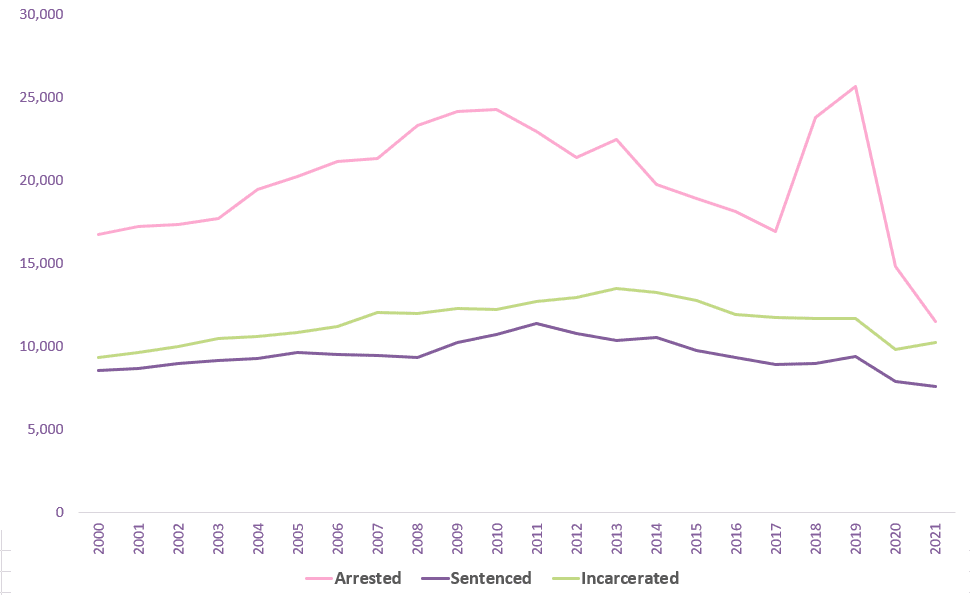
Calculations by the Women’s’ Institute for Science, Equity and Race. Data Source: Bureau of Prisons (BOP)

Graph 2: Non-US Citizen Females Incarcerated
Calculations by the Women’s’ Institute for Science, Equity and Race. Data Source: Bureau of Prisons (BOP)
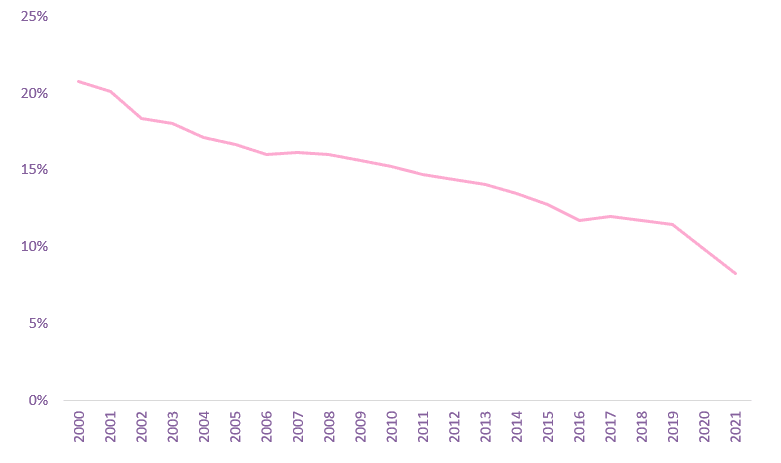
Disaggregating the incarceration data highlights several important trends. First, the percentage of non-US citizen women incarcerated experienced over a 10 percent decline over this period (see Graph 2). This decreasing incarceration rate is the exact opposite of the increasing federal arrest rate of Non-US citizens found in a 2019 Bureau of Justice Statistics report and in part one of this report. In addition, while the Department of Homeland Security has prioritized deporting noncitizens who pose a serious threat to public safety or national security, the data shows that prison rates for non-us citizen females began decreasing long before then.
The Impact of Race and Ethnicity on Incarceration Trends
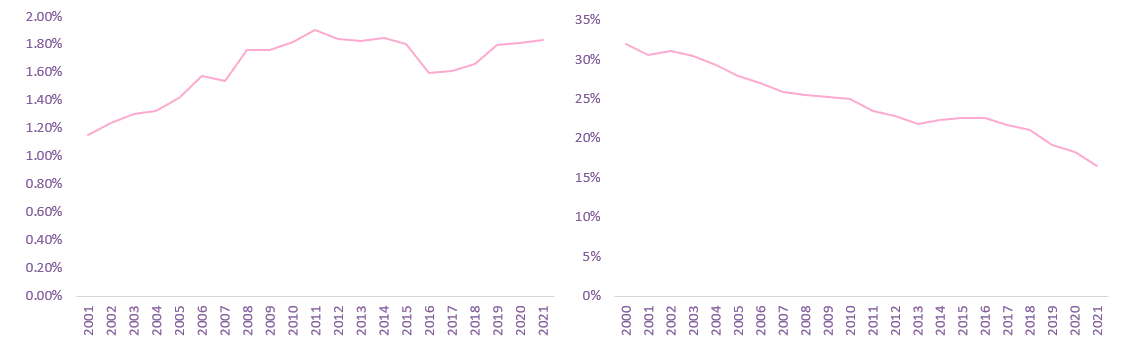
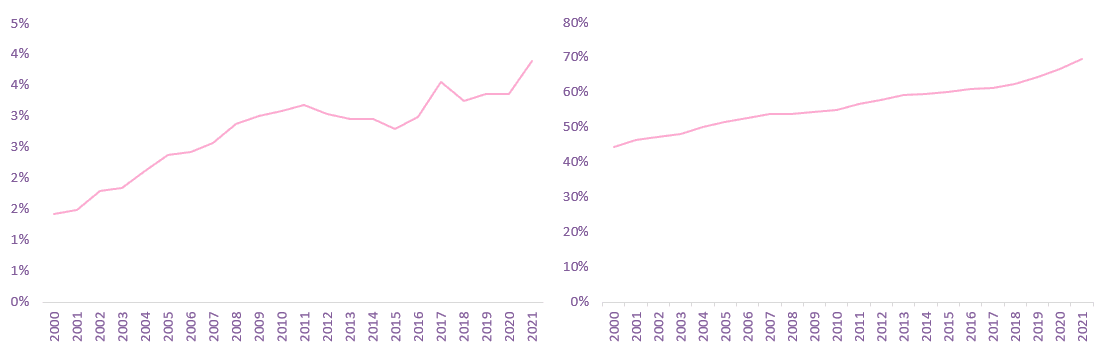
Asian females have remained between 1 and 2 percent of the total federal female prison population over this period (see Graph 3), while White and Native American females’ prison population have shown percentage increases of 26 percent and 3 percent respectively. Although a 3 percent increase may seem small for Native American females, this represents a 300 percent increase and matches the increase seen in total arrests for Native American females (see Graph 5). Black female prison population percentages have been reduced by half. In 2000 Black females were 32 percent of the total federal female prison population, by the end of 2021 their percentage was 16 percent (see Graph 4).
Graph 3: Asian Female Prison Population % Graph 4: Black Female Prison Population %
Calculations by the Women’s’ Institute for Science, Equity and Race. Data Source: Bureau of Prisons (BOP)
Graph 5: N. American Female Prison Population % Graph 6: White Female Prison Population %
Calculations by the Women’s’ Institute for Science, Equity and Race. Data Source: Bureau of Prisons (BOP)
When we disaggregate the data by ethnicity, we see that during this period, Hispanic females represented about 29 percent of the total federal female prison population on average. In addition, Hispanic females experienced an overall increase in prison population representation from 2000 to 2021 (see Graph 7). An even deeper analysis of ethnicity by identified racial categories reveals a similar pattern we observed in our sentencing analysis. On average, 41 percent of White females were also identified as Hispanic and 95 percent of females who were identified as Hispanic were considered White as well (see chart 2). Therefore, it is important to isolate race and ethnicity when conducting any analysis of criminal justice population demographics.
Graph 7: Hispanic Female Prison Population %
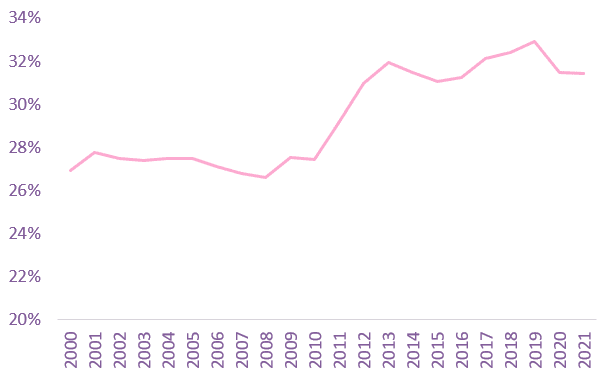
Calculations by the Women’s’ Institute for Science, Equity and Race. Data Source: Bureau of Prisons (BOP)
Chart 2: Percentage of White/Hispanic vs Hispanic/White Females
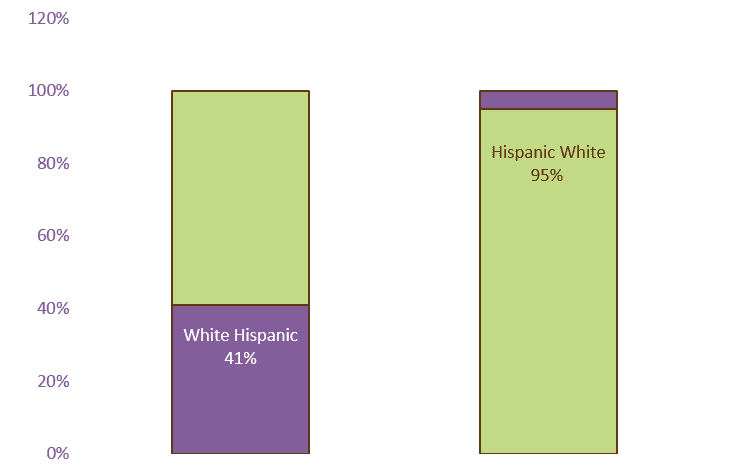
Calculations by the Women’s’ Institute for Science, Equity and Race. Data Source: Bureau of Prisons (BOP)
Incarceration Rates by Offense Type
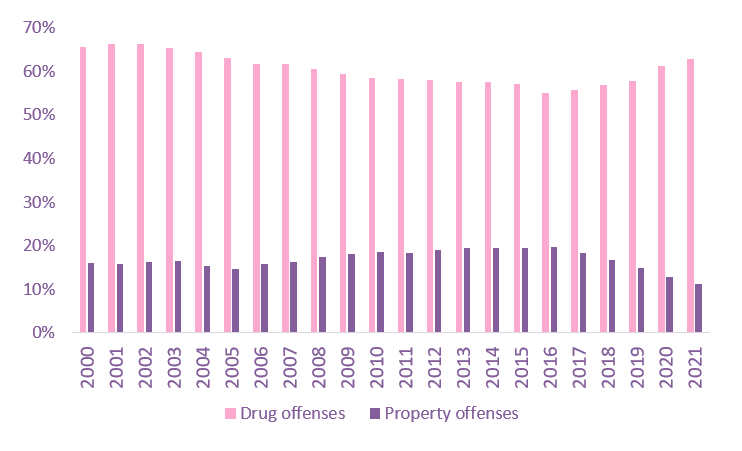
The leading offense types for federal female arrests were immigration, property, drug, and supervision violations. When we examined the offense types of women incarcerated in federal prisons we found that property and drug offenses were the top 2 categories of offenses for women in federal prison (see Chart 3). Drug offenses remain the leading offense category for females incarcerated in federal prisons even though the number of female arrests for drug offenses has decreased significantly since 2000.
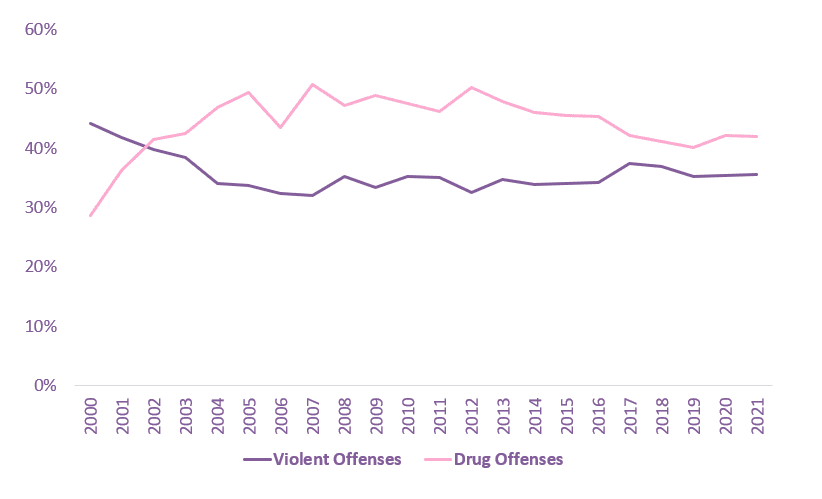
Disaggregating offense type data by race highlights the lone exception to this pattern. For Native American females, violent offenses rank second behind drug offenses for the top two offense categories (see Graph 8). This peculiar anomaly is likely a signal of a much deeper problem of violence rooted in the Native American community.
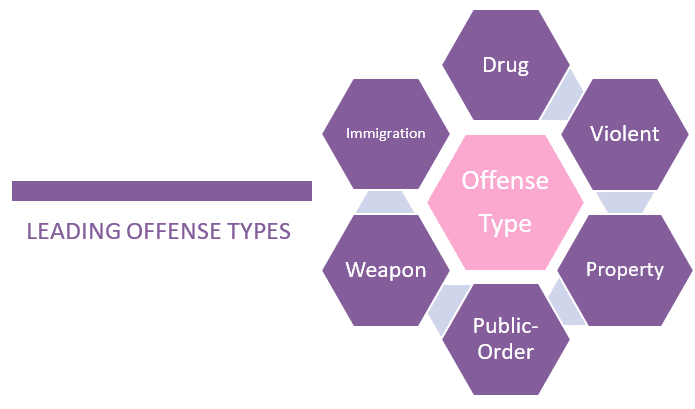
Chart 3: Leading Offense Types for Incarcerated Females 2000 – 2021
Calculations by the Women’s’ Institute for Science, Equity and Race. Data Source: Bureau of Prisons (BOP)
Graph 8: Leading Offense Types for Native American Incarcerated Females 2000 – 2021
Calculations by the Women’s’ Institute for Science, Equity and Race. Data Source: Bureau of Prisons (BOP)
The National Institute of Justice found that over 84 percent of American Indian women have experienced violence in their lifetime. Some of these women could be committing violent crimes in an effort to fight back against such violence. A survey conducted of women across 22 states who were convicted of murder or manslaughter found that over 60 percent reported physical, sexual, or emotional abuse or some combination of abuse prior to incarceration.
From Young to Old, What Role Does Age Play
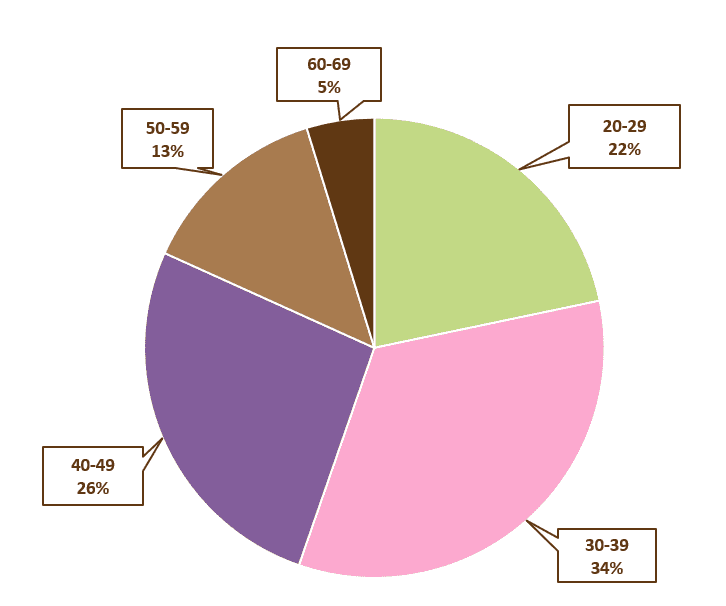
Chart 4 shows the percentage of females incarcerated in federal prison by age. The largest percentage of incarcerated females are between 30 and 39 years old (34 percent), and the smallest is between 60 and 69 years old (5 percent). The greatest cause for concern is that on average, over 50 percent of females incarcerated in federal prison are within their prime child-bearing age (20 – 39 years old). If we also include females between 40 and 44 years old, that percentage rises to nearly 70 percent.
Chart 4: Average Percentage of Females Incarcerated by Age
Calculations by the Women’s’ Institute for Science, Equity and Race. Data Source: Bureau of Prisons (BOP)
This is an issue not only because of the various challenges these women face directly but also because of the potential children they leave behind, sometimes with no one to care for them. A study produced by the Pew Research Center found that 85 percent of women in the U.S. had given birth by age 44. Furthermore, an Equal Justice Initiative report states that 60 percent of women in state prisons have minor children. Such separation adds an additional stress to an already desperate situation.
Equal Crime Equal Time?
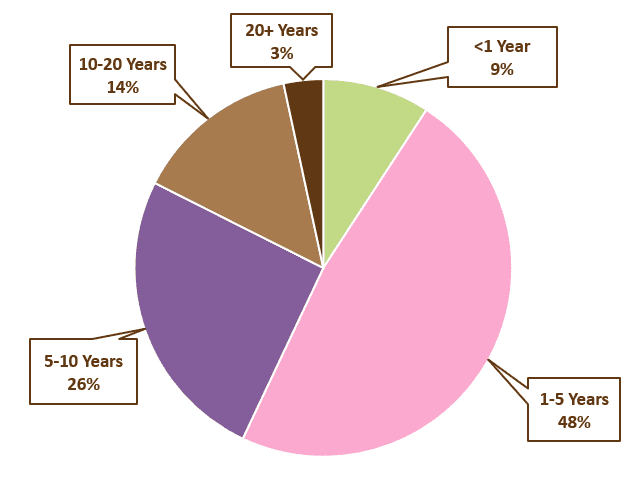
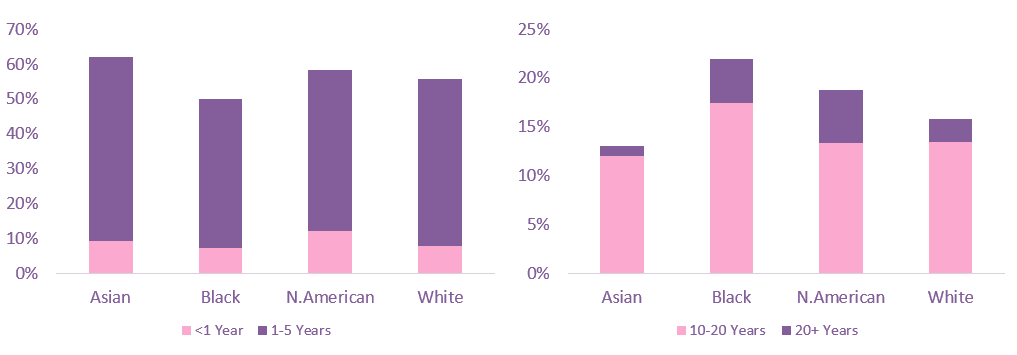
Last, we examined the average term length for females incarcerated in federal prison, and the length of prison sentences issued at sentencing. Close to 60 percent of females in federal prison have sentences of five years or less (See Chart 5).These short term limits highlight the need for programs structured to assist women upon reentry into their communities post incarceration. We also see that on average only around 3 percent of females incarcerated in federal prison have sentences longer than 20 years.
Chart 5: Average Percentage of Females Incarcerated by Sentence Length
Calculations by the Women’s’ Institute for Science, Equity and Race. Data Source: Bureau of Prisons (BOP)
Chart 6: Avg. Sentence Length <5 years Chart 7: Avg. Sentence Length >10 years
Calculations by the Women’s’ Institute for Science, Equity and Race. Data Source: Bureau of Prisons (BOP)
When we disaggregate this data by race there is no obvious pattern of unequal sentencing; however, we do find some interesting results. Black women have the lowest percentage of sentences less than 5 years and the highest percentage of sentences greater than 10 years (See Charts 6-7). While it may appear that this suggests that black women are being over sentenced, it is important to point out that black females have the highest rate of incarcerations for violent offenses. Violent offenses typically receive longer sentences than other types of offenses. More research is needed to conclude whether black females are being unfairly sentenced based on this data.
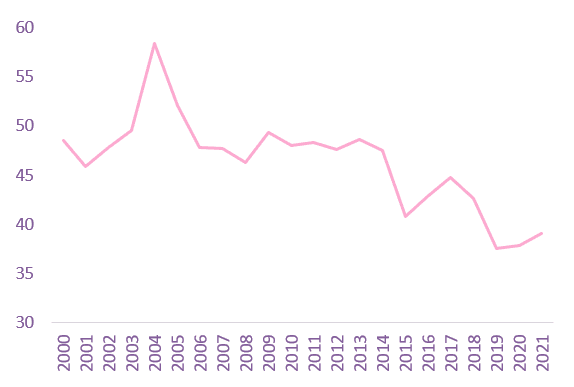
The data on Native American females produces a different set of interesting results. In Charts 6 and 7 we see that Native American females rank second in both sentences less than 5 years and more than 10 years. There are two possible explanations for this. First, at the beginning of the time period analyzed, Native American females were receiving sentencing between one to five years at very high rates. At its peak in 2004, nearly 60 percent of Native American women incarcerated had sentences between one to five years. By 2021, that percentage had dropped to 39 percent (See Graph 9).
Graph 9: Avg. Percentage of Native American Females Sentenced 1-5 years
Calculations by the Women’s’ Institute for Science, Equity and Race. Data Source: Bureau of Prisons (BOP)
Second, as highlighted in part one of this report, which focused on arrest trends, the number of Native American females involved with the criminal justice system has risen and continues to rise at a high rate. An average of 36 percent of Native American women incarcerated over this period have committed violent offenses; therefore, it is not surprising that they constitute a high percentage of women with sentences greater than 10 years.
Recommendations
- Invest more in programs focused on the specific needs of the female prison population.
- Increase programs and policies that promote family engagement, particularly for mothers who are incarcerated.
- Establish alternative sentencing programs that will help keep women who commit crimes against documented abusive domestic partners out of prison.
Conclusions
The role of the criminal justice system is to protect the vulnerable and keep our communities safe. The secondary role could and should be to serve as a stabilizing mechanism for individuals. In each part of this report, we highlight areas with potential for improvement–from arrests through sentencing to incarceration. The criminal justice system does not have to be a revolving door for lifetime criminals. With some strategic changes, we can reverse this current trend for women of rising arrests, sentencing, and incarcerations.
Jerry L. Pender is the Research Director specializing in childcare, affordable housing, and criminal justice reform.