

As someone who works from home with central air, I can manage extreme heat, but it is expensive. Scientists suggest global warming will cause more days of extreme heat and more heat-related deaths. Over the next week, extreme heat is expected in several states (see Figure 1)
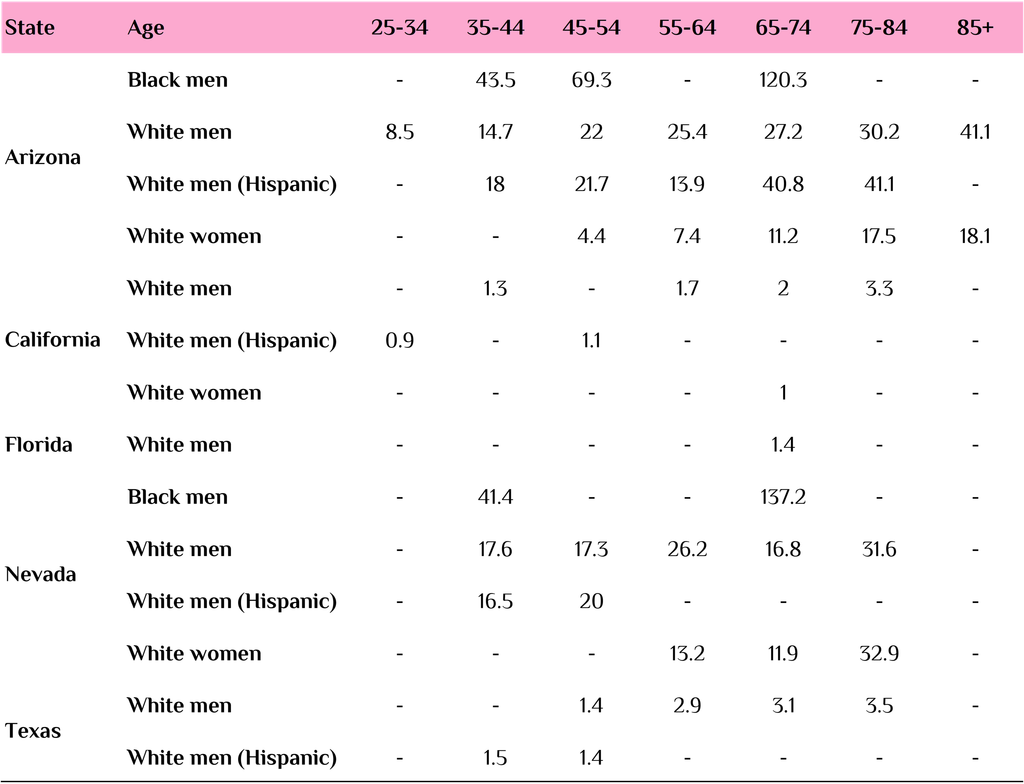
The Centers for Disease Control and Prevention collects data on deaths from heat-related illnesses and makes it available through WONDER. Unfortunately, the demographics of 57% of heat-related deaths are suppressed, approximately 1,263 deaths. To contextualize why these deaths matter, age-adjusted heat mortality rates rose 63% nationally between 1999 and 2023, yet we cannot disaggregate that trend by race or ethnicity in most states. For the 43% of deaths with reported rates, data are available for Black men, Hispanic men, and Whites. Table 1 reports the crude rate, not the count, to show disparities in death rates.
Table 1. Heat Deaths Crude Rates: 2024
Source: Suggested Citation: Centers for Disease Control and Prevention, National Center for Health Statistics. National Vital Statistics System, Mortality 2018-2024 on CDC WONDER Online Database, released in 2026. Data are from the Multiple Cause of Death Files, 2018-2024, as compiled from data provided by the 57 vital statistics jurisdictions through the Vital Statistics Cooperative Program. Accessed at http://wonder.cdc.gov/mcd-icd10-expanded.html
Black men show the highest heat mortality rates of any group in this dataset, ranging from 41.4-43.5 per 100,000 in the 35-44 bracket to a peak of 120.3-137.2 per 100,000 in the 65-74 bracket across Arizona and Nevada. By contrast, White Hispanic men show more variation, with rates as low as 0.9-1.5 per 100,000 in California and Texas. Their rates climb to 40.8-41.1 per 100,000 in Arizona for the 65-84 age range, suggesting that state of residence drives as much variation within this group as age does. White women follow a similar geographic pattern at lower magnitudes, ranging from 1.0 per 100,000 in California’s 65-74 bracket up to 32.9 per 100,000 in Nevada’s 75-84 bracket. White non-Hispanic men display the widest state-level spread of any group, ranging from as low as 1.4 per 100,000 in Florida’s and Texas’s 65-74 bracket to 41.1 per 100,000 in Arizona’s 85+ bracket.
The data suggest age and geography influence death rates. Yet the reasons behind this state-by-state variation may be explained by housing infrastructure: home cooling access, which has not been tracked federally by race and ethnicity for over 40 years.
A Half-Century Data Gap on Cooling Access
The Census Bureau has not asked Americans whether their home has air conditioning since the 1980 Census, when the long-form questionnaire asked respondents whether they had central air, a window unit, or none at all. The American Community Survey, which replaced the long-form Census in 2005 and remains the primary source for housing and demographic cross-tabulations today, did not restore the air-conditioning question. Hence, there is no federal dataset that directly links race, sex, and ethnicity to household-level cooling access.
Since national air-conditioning access rose from under 2% in 1955 to over half of homes by 1980, the Census may have decided that air conditioning no longer warranted tracking. However, by 1993, only 68% of occupied housing units had air conditioning — nearly a third of American households lacked it, and were disproportionately lower-income and renter-occupied. AC didn’t reach the 87-90% range, often cited as “near-universal,” until the 2009-2020 RECS survey cycles, decades after the Census stopped asking.
Whatever the rationale, the inequality measured by the question persisted. Current Energy Information Administration data shows 18% of households below the poverty line have no air conditioning at all, and low-income households are more than twice as likely to rely on less-effective window units (33%) rather than central air (44%) compared to higher-income households, where 75% have central air. EIA data is not collected alongside race and ethnicity at a disaggregated level, so we cannot verify whether Asian, Black, Hispanic, Indigenous American, or Multiracial households are disproportionately represented in that uncooled or under-cooled population.
The Policy Implication
When heat mortality data is suppressed for entire demographic groups, and housing infrastructure data are absent, we cannot identify who is most at risk. Until these gaps are closed, heat policy will continue to protect the populations we can measure, while leaving the populations most vulnerable to death from heat exposure invisible by design.
Stay sharp and keep cool,
Rhonda V. Sharpe is the president and founder of the Women’s Institute for Science, Equity and Race. Her research focuses on gender and racial inequality, diversity in STEM, and the demographics of higher education.