
Introduction
This study examines changes in arrest rates for women from 2000-2021, which captures changes during the Great Recession, recovery, and the start of the COVID-19 pandemic. We seek to identify changes in arrest rates for women that may reveal disparities by race, thereby providing support for criminal justice reform that leads to more equitable outcomes.
We utilize data from the U.S. Marshals Service – USMS Prisoner Tracking System (PTS). Race is defined as the race of the arrestee (Asian/Pacific Island, Black/Black Hispanic, American Indian/Alaskan, White/White Hispanic/, Unknown); therefore, Hispanics are not isolated as they are not a racial group. A citizen is defined as a U.S. citizen or non-US citizen. The analysis is descriptive and seeks to answer the following questions:
- What are the arrest trends for females for 2000-2021?
- How do arrest trends change when the data are disaggregated by race and sex?
- Do arrest trends vary by citizenship?
Female Arrest Trends
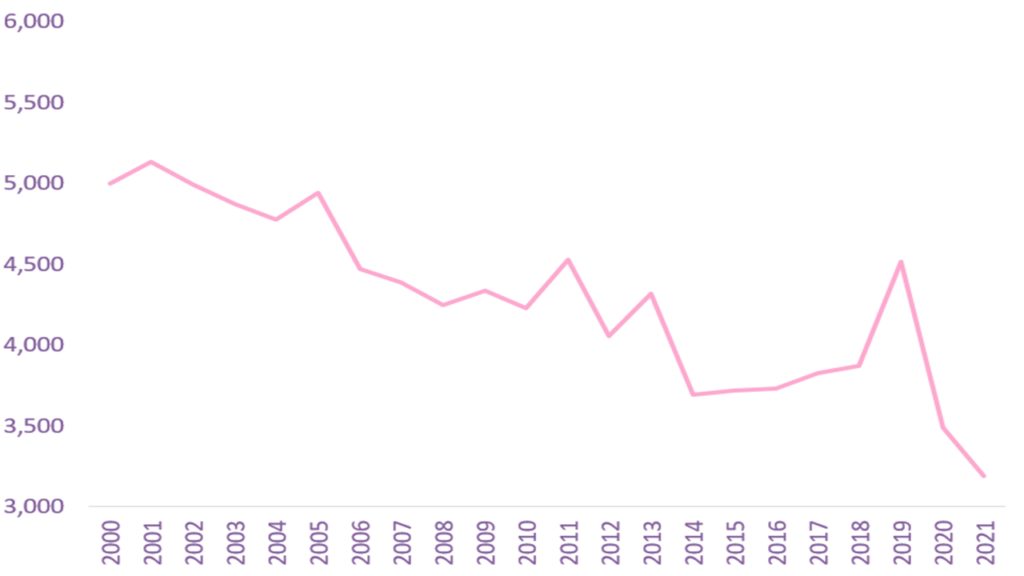
Graph 1 shows an upward trend in total female arrests from 2000 to 2021. The overall female arrest has trended upward over this period. Significant increases in 2004 and 2008 could be explained by high unemployment rates extended from previous recessions in 2001 and 2007.
Graph 1: Total Female Arrest 2000 – 2021
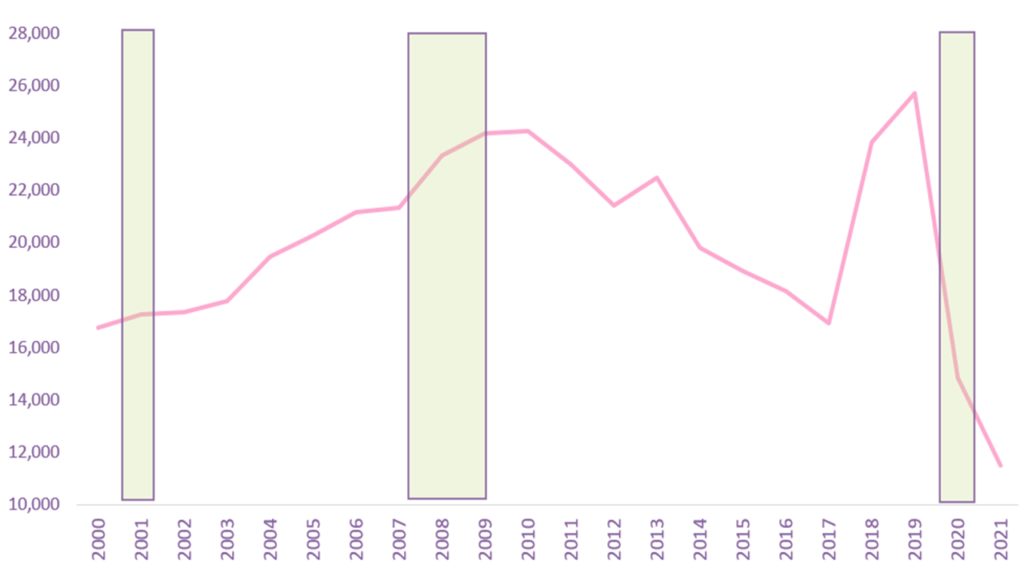
Source: Calculations by the Women’s Institute for Science, Equity and Race. Data Source: U.S. Marshals Service – USMS Prisoner Tracking System (PTS)
Following a peak in arrests in 2010, there was a steady decrease in arrests until 2018, except in 2013 when there was a 4.89 percent increase in arrests. In addition, there was a 42 percent decrease in arrests during the COVID-19 pandemic. Graph 2 shows the top four offense types for female arrest. While property offenses, drug offenses, and supervision violations either decreased or remained flat over the period, immigration offenses increased significantly before the pandemic.
Graph 2: Leading Offense Types for Female Arrest
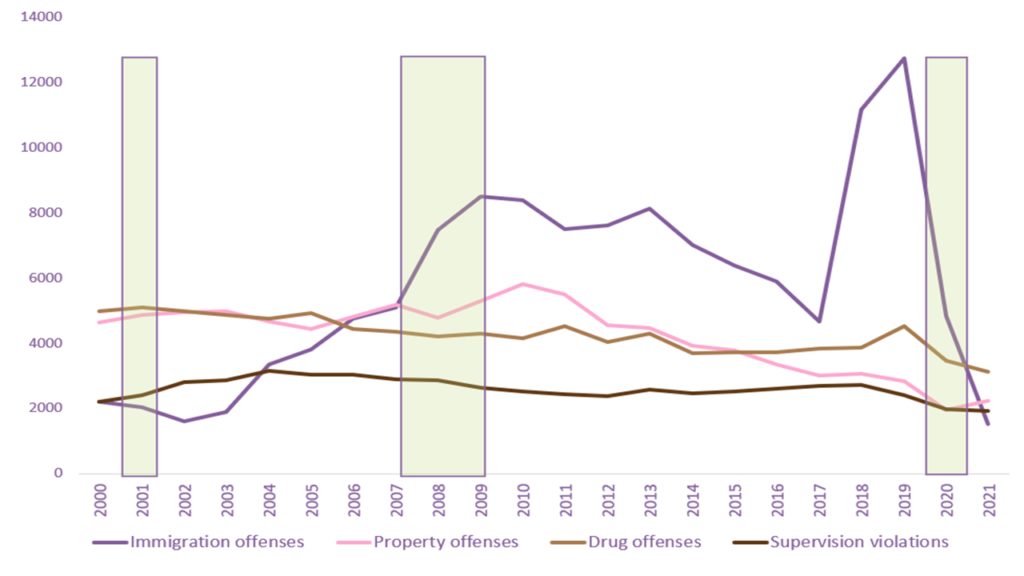
Source: Calculations by the Women’s Institute for Science, Equity and Race. Data Source: U.S. Marshals Service – USMS Prisoner Tracking System (PTS)
Disaggregating our data by race (Graphs 3 – 6) shows that even if total female arrests are trending upward at the federal level, it doesn’t mean that each demographic of women is experiencing the same shifts.
Graph 3: Total Asian Female Arrests Graph 4: Total Black Female Arrests
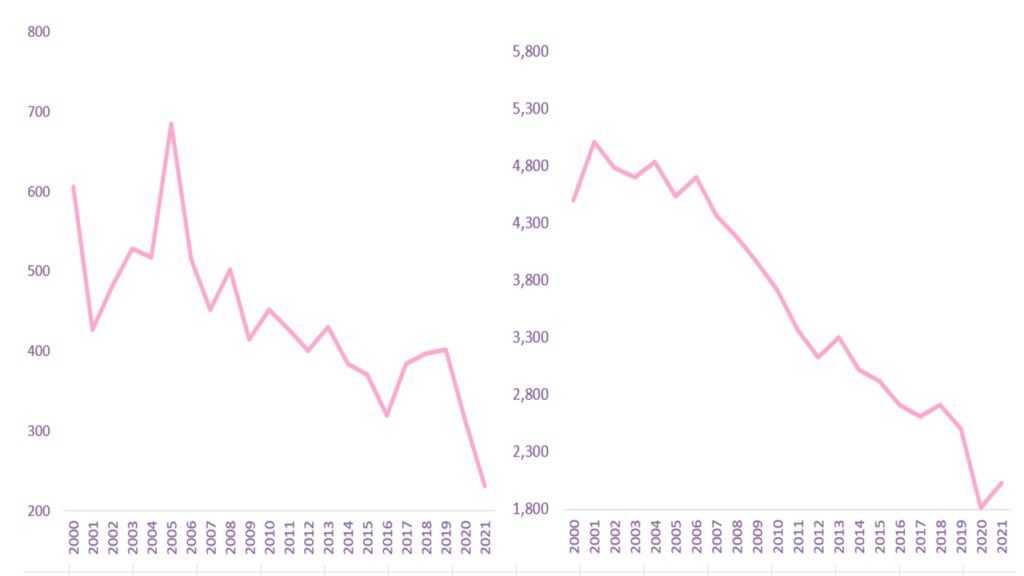
Source: Calculations by the Women’s Institute for Science, Equity and Race. Data Source: U.S. Marshals Service – USMS Prisoner Tracking System (PTS)
Asian and Black women have had a decrease in total arrests over that period, while Native American and White women have had an increase.
Graph 5: Total Native American Female Arrests Graph 6: Total White Female Arrests
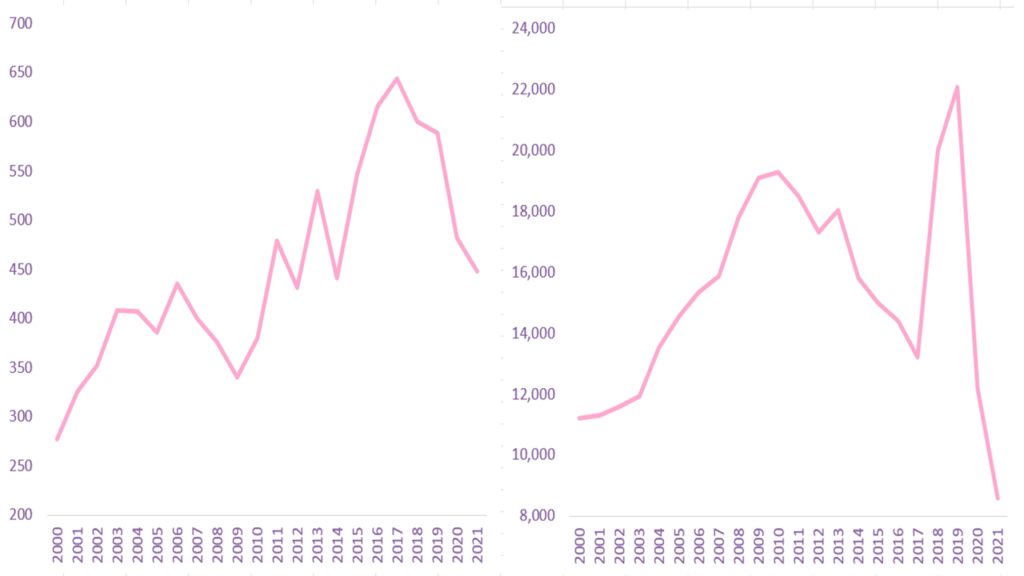
Source: Calculations by the Women’s Institute for Science, Equity and Race. Data Source: U.S. Marshals Service – USMS Prisoner Tracking System (PTS)
How are Drug Offenses Impacting Trends
It is helpful to see how these trends differ, but it is also important to investigate why these differences might be occurring. Prison Policy Initiative found in their 2020 report that drug related arrests increased nearly 216 percent from 1985 to 2019. However, our data show an overall decrease in total drug related
Graph 7: Female Arrests for Drug Offenses: 2000 – 2021
Source: Calculations by the Women’s Institute for Science, Equity and Race. Data Source: U.S. Marshals Service – USMS Prisoner Tracking System (PTS)
Arrests. In addition, even when we isolate the total arrests of Native American and White females to see if their individual increases in total arrests can be attributed to a rise in drug offenses, we find that, in 2000, Native American females were arrested 37 times and White females were arrested 3,566 times for drug offenses. In 2021, White females were arrested for drug related offenses fewer times, 2,484, while Native Americans experienced an increase to 80 arrests, over twice as many times as in 2000.
Does Citizenship Status Play a Role
We further and disaggregate our arrest data by citizenship to identify, if any, differences in arrest trends by citizenship status. For Asian female citizens, total arrests remained relatively flat, but non-citizen Asian females experienced a decrease in total arrests (See Graph 8)
Graph 8: Arrest Trends for Asian Females by Citizenship Status: 2000 – 2021
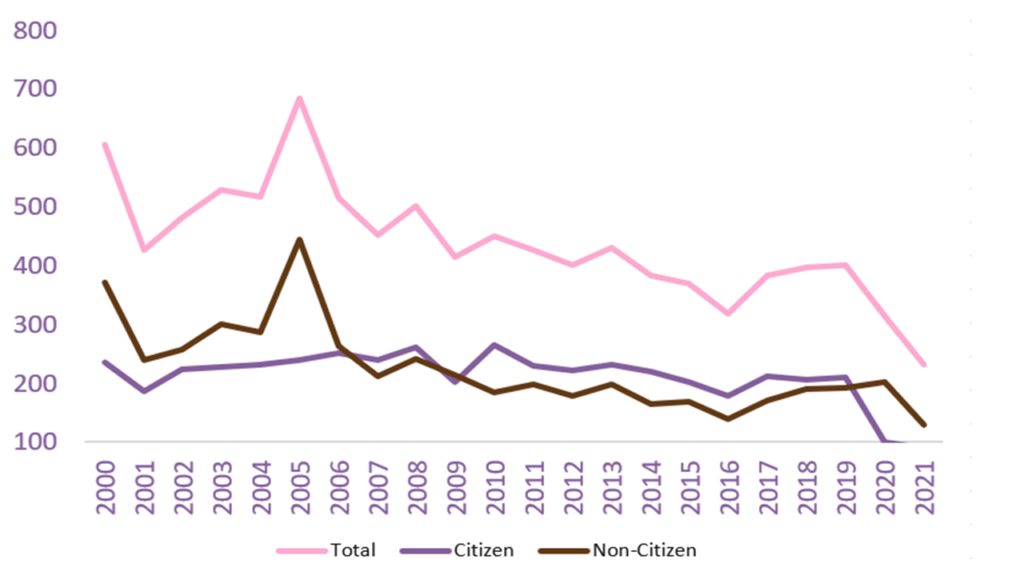
Source: Calculations by the Women’s Institute for Science, Equity and Race. Data Source: U.S. Marshals Service – USMS Prisoner Tracking System (PTS)
When we look at the statistics for Black females (see Graph 9), although both groups trend downward, one notable difference is the relatively low arrest totals for non-citizen Black females compared to Black female citizens. In 2000, non-citizens represented 15 percent of all Black female arrests at the federal level, and in 2019 that number was even lower at around 6 percent. Only Native American females have a lower percentage in this category (8 percent in 2000, 1 percent in 2019).
Graph 9: Arrest Trends for Black Females by Citizenship Status: 2000 – 2021
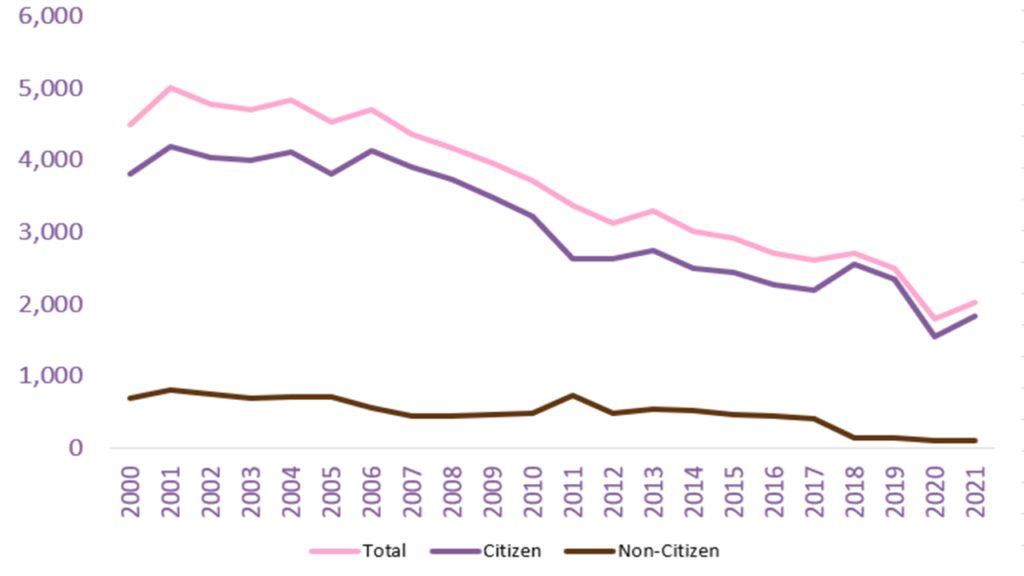
Source: Calculations by the Women’s Institute for Science, Equity and Race. Data Source: U.S. Marshals Service – USMS Prisoner Tracking System (PTS)
Native American females are experiencing the most troubling trend, particularly when we focus on the arrest of Native American female citizens (see Graph 10). Although their arrest totals are low, they have experienced nearly a 130 percent increase since 2000, the largest increase in total arrests except for White non-citizen females. This is similar to results found in a study conducted by Native News Online. This increase is more difficult to explain than the increase we see for White non-citizen females, which seem to be due to the increasing arrests of illegal immigrants. One explanation stated by Dr. Cirara Hansen, a clinical psychologist in the lina’ Counseling services department at the Northern Navajo Medical Center, is that “Like many modern challenges in Indian Country, over-incarceration of Indigenous people is intimately tied to colonial violence and upheld by policies throughout the years.”
Graph 10: Arrest Trends for Native American Females by Citizenship Status: 2000 – 2021
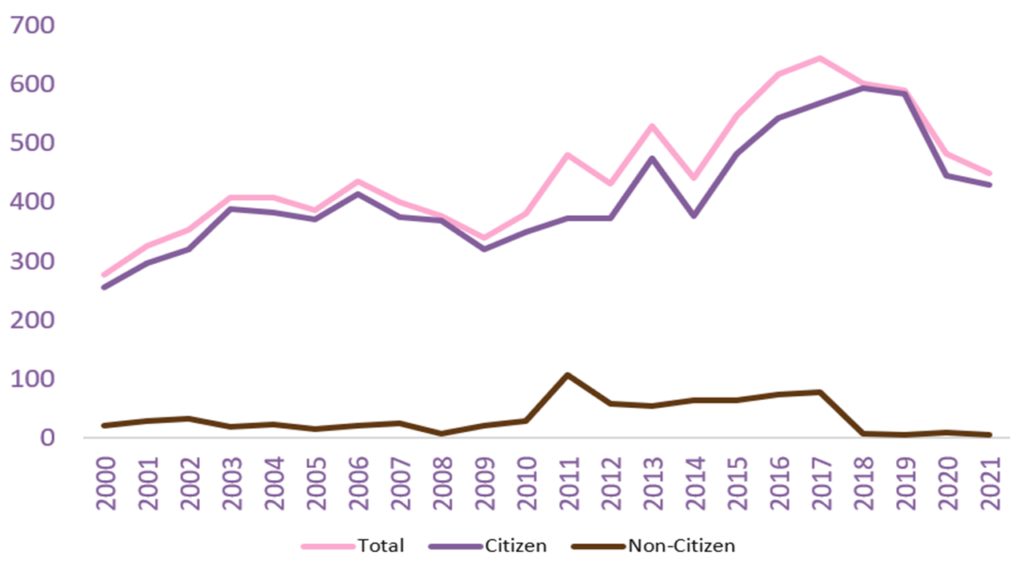
Source: Calculations by the Women’s Institute for Science, Equity and Race. Data Source: U.S. Marshals Service – USMS Prisoner Tracking System (PTS)
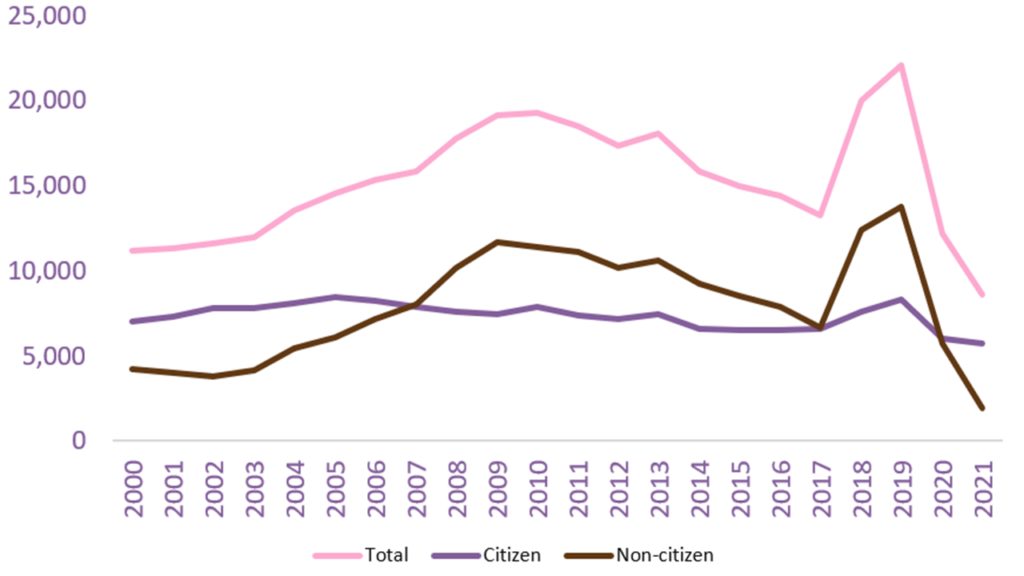
Finally, looking at the total arrest trend for White females, we find an initially somewhat deceptive result. Without disaggregating the data by citizenship, it appears there has been an enormous increase in the arrest of White females over this period. That has not been the case. While there has been a 96 percent increase in the number of total arrests for White females, this has been driven largely by the increase in the arrest of White non-citizen females, who have experienced a 227 percent increase in total arrests over this period.
Graph 11: Arrest Trends for White Females by Citizenship Status: 2000 – 2021
Source: Calculations by the Women’s Institute for Science, Equity and Race. Data Source: U.S. Marshals Service – USMS Prisoner Tracking System (PTS)
The most plausible explanation according to the data is the increase in arrests related to immigration offenses. In 2000, there were 1,920 White females arrested for immigration offenses. In 2019, there were 12,537. That’s a 553 percent increase. White female citizens only experienced an 18 percent increase in total arrests for any offense over that period.
Graph 12: Arrests of White Non-Citizen Females: 2000 vs. 2021
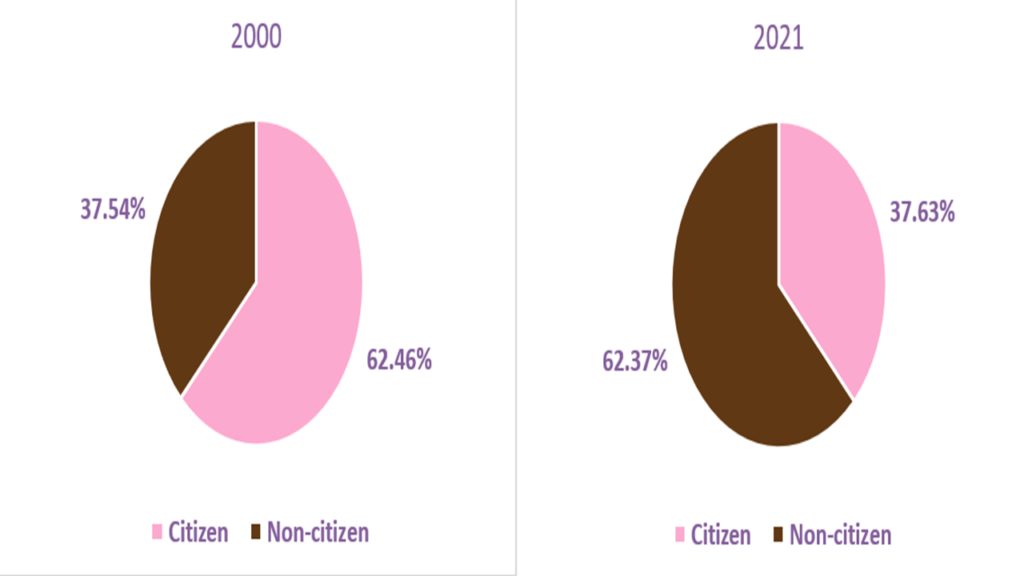
Source: Calculations by the Women’s Institute for Science, Equity and Race. Data Source: U.S. Marshals Service – USMS Prisoner Tracking System (PTS)
This study shows that, on the federal level at least, the increases in total arrests for women may be less related to drug offenses and more related to an increase in immigration offenses. While solutions in both areas are needed, it is important to devote the proper number of resources to appropriate areas of need. In addition, while this study helps shed some light on the issue of arrests and bookings, this is just one aspect of the criminal justice system. A comprehensive look into the court system and institutional facilities responsible for housing and releasing these individuals must also take place in order to get a full picture of the criminal justice landscape and how it is affecting each individual group of women.
Jerry L. Pender
Director of Research
